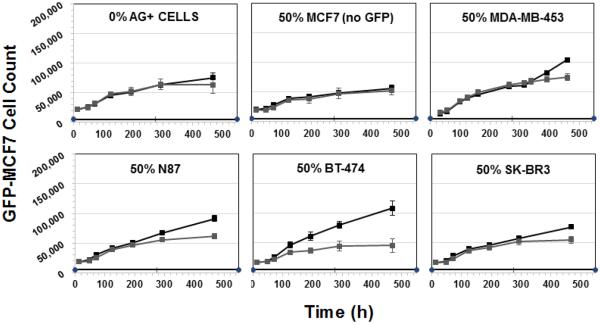
Figure 9.
Cell viability profiles for GFP-MCF7 cells in co-cultures with 0% Ag+ cells, 50% unlabeled MCF7 cells, 50% MDA-MB-453 cells, 50% N87 cells, 50% BT474 cells, and 50% SKBR3 cells. Black lines represent control group without ADC treatment and the gray lines represent the group treated with 100 nM T-vc-MMAE ADC.

