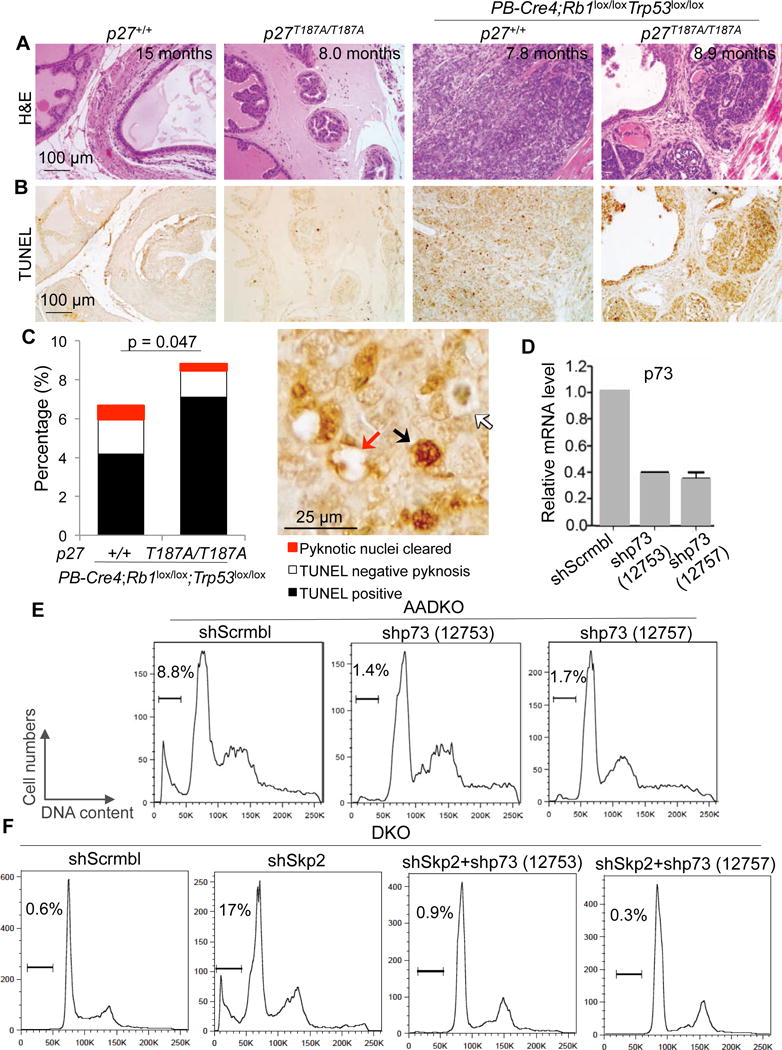
Figure 3. p27T187A KI increased apoptosis in DKO prostate tumorigenesis and p73 played a major role in the apoptosis.

(A and B) Consecutive prostate sections of four genotypes, as indicated, stained with H&E or TUNEL. (C) Quantification of apoptosis. Arrows in the photograph demonstrate how total apoptosis was quantified. About 200 cells on each section/mouse were counted. The bar graph was based on the average of quantifications from three mice. p value is by two-sided t test comparing the combined apoptosis in p27+/+ and p27T187A/T187A mice. (D) RT-qPCR to determine knockdown efficiencies by two shp73 constructs. Error bars are s.e.m. (E and F) Propidium iodide based DNA content FACS (representative of two experiments) to detect and quantify apoptosis as sub-G1 cell% in the population, as marked above the brackets.
