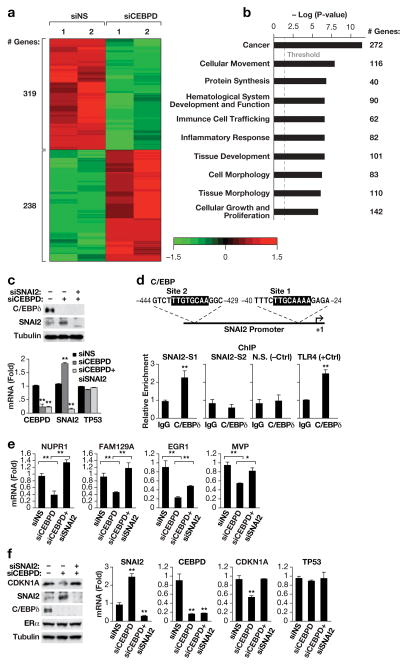
Figure 3. C/EBPδ inhibits SNAI2 expression.
A) Heat map generated by Partek Genomics Suite showing the global changes in gene expression (fold change 1.5, P<0.05) upon C/EBPδ-silencing as determined by mRNA-Seq analysis. MCF-7 cells were transfected with siRNA against C/EBPδ or non-specific control and RNA was harvested 48 h later (n=2). B) Schematic generated by Ingenuity Pathway Analysis showing the top ten most significantly represented “biological functions” by the DEGs (P values: 3.08E-07 to 4.18E-12) from Supplementary Figure S7. Enrichment score is reported as the minus log transformation on the geometric mean of P-values from the enriched annotation terms associating with one or more of the gene group members. The genes are clustered into significantly enriched groups for specific biological functions. The threshold line indicates at P-value of 0.05. The number of genes in each group is indicated on the right. C) Western analysis (left) of C/EBPδ and SNAI2 protein levels and QPCR analysis (right) of C/EBPδ (CEBPD), SNAI2 and p53 (TP53) mRNA levels in MCF-7 cells 48 h after nucleofection with siRNAs against non-specific control (-,siNS), C/EBPδ (siCEBPD) or SNAI2 (siSNAI2) (n=3, * P<0.05 and ** P<0.01 when compared to siNS). D) Schematic (upper panel) showing the potential binding sites for C/EBP proteins in the SNAI2 promoter, and quantification of QPCR analyses (lower panels) of DNA fragments in chromatin immunoprecipitation (ChIP) assays with MCF-7 cells and C/EBPδ-specific antibodies or IgG as control. The primers were specific for regions encompassing sites 1 and 2 (SNAI2-S1,-S2), a genomic region without C/EBP binding motif (N.S.) as negative control, and the C/EBPδ binding site in the TLR4 promoter4 as positive control (n=3,** P<0.01). E) QPCR analysis of the mRNA expression levels of the indicated genes in MCF-7 cells as in panel A (n=3, * P<0.05, ** P<0.01). F) Western blot analysis (left) of C/EBPδ, SNAI2, CDKN1A and ERα protein levels and QPCR analysis (right) of C/EBPδ, SNAI2, CDKN1A and p53 mRNA levels in MCF-7 cells 48 h after nucleofection with siRNAs against non-specific control (-,siNS), C/EBPδ (siCEBPD) or SNAI2 (siSNAI2) (n=3,** P<0.01 when compared to siNS).

