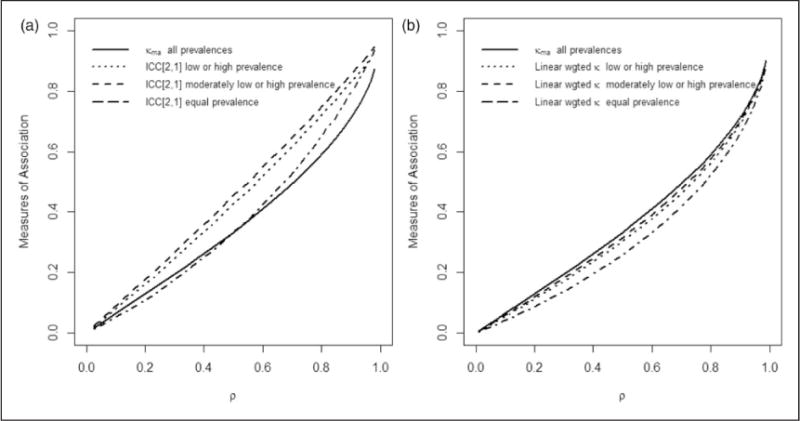
Figure 2.

Plots of measures of association versus ρ at different prevalences (a) Shrout and Fleiss’ ICC[2,1] and κma; (b) κma and Cohen’s GLMM-based weighted kappa with linear weights κGLMM,a. The prevalence is varied (extreme low or high; moderately high or low; equal in each category) with the percent of observations falling into each of the C = 5 categories for each prevalence case given in Table 5.
