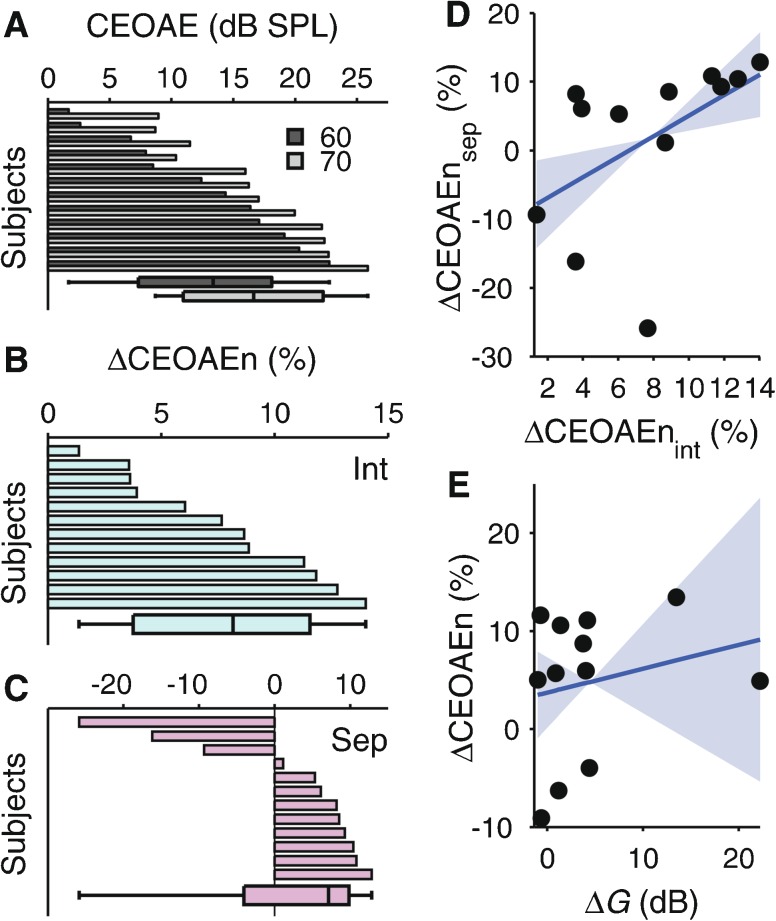
FIG. 8.
A Individual without-elicitor CEOAE amplitudes for the 60- and 70-dB pe SPL click levels (dark- and light-gray bars), sorted in order of the size of the CEOAE amplitudes for the 60-dB pe SPL clicks. B, C Individual normalized CEOAE suppression indices, ΔCEOAEn (Mishra and Lutman 2014; negative values of ΔCEOAEn denote elicitor-induced CEOAE enhancement), for the interleaved (B) and separate (C) sessions, sorted for size (independently). The bars and whiskers at the bottom of each panel show the respective medians, percentiles, and absolute ranges as in the previous figures. D Across-subject relationship between ΔCEOAEn for the interleaved and separate sessions. E Across-subject relationship between the elicitor-induced gain reductions, ΔG, estimated from the TMCs, and ΔCEOAEn, averaged across sessions. The blue, solid lines show the regressions lines and the light-blue highlight the bootstrap confidence intervals of the regression slopes.

