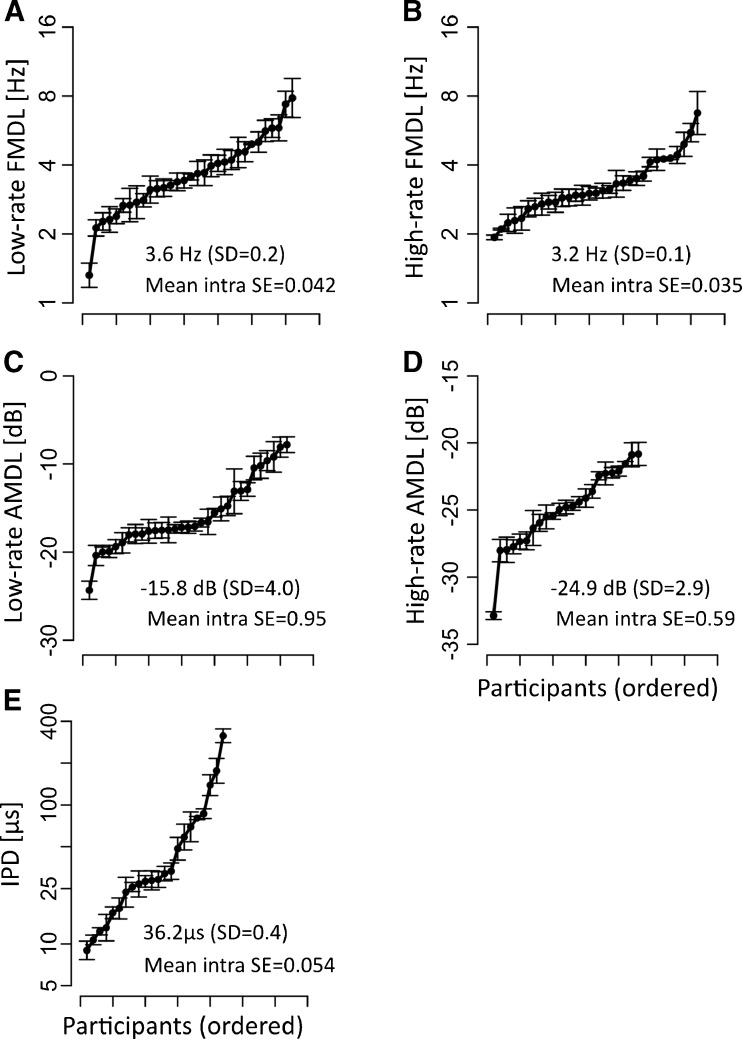
FIG. 2.
Psychoacoustic thresholds of individual listeners. The symbols and error bars show means and standard errors (on a logarithmic scale), respectively. Each panel represents one task: A low-rate FMDLs, B high-rate FMDLs, C low-rate AMDLs, D high-rate AMDLs, and E IPDs. The participants are ordered along the x-axis according to their threshold. The ordering was done independently for each task and was different for each task. The average threshold for each task (with standard deviation) and mean intra-individual variation for each threshold (mean intra SE) are given as an inset in each panel.

