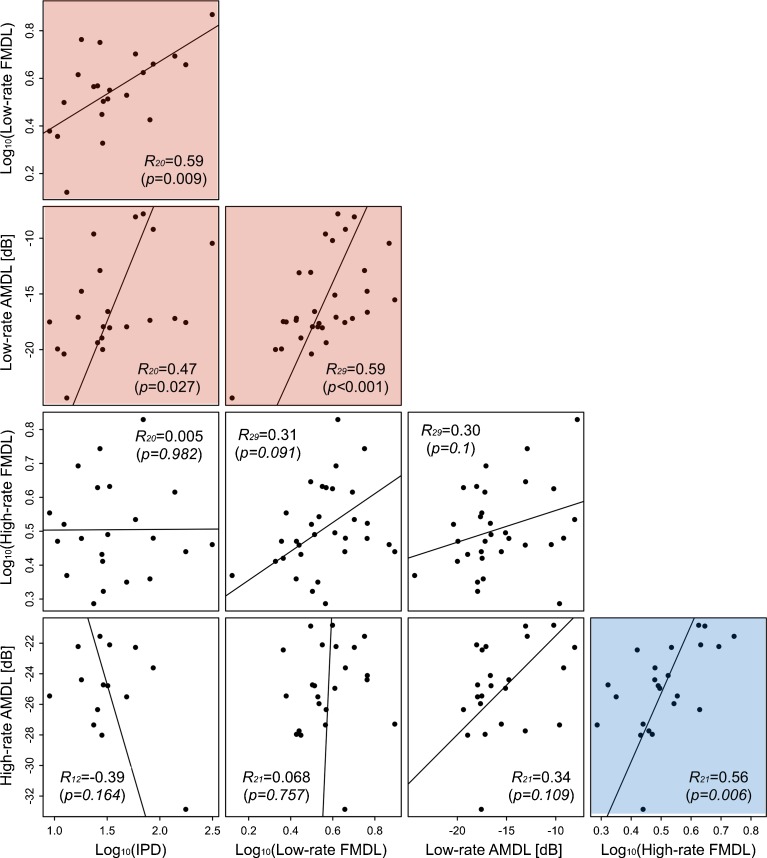
FIG. 3.
Scatterplots of thresholds for pairs of tasks. Each panel represents one pair. Each symbol represents one participant. Regression lines were derived from linear orthogonal regression. Pearson correlation coefficients are shown with subscripts indicating the number of participants, and p values are indicated in parentheses. Significant correlations were found among IPD thresholds, low-rate AMDLs, and low-rate FMDLs (red background) and among high-rate AMDLs and high-rate FMDLs (blue background).

