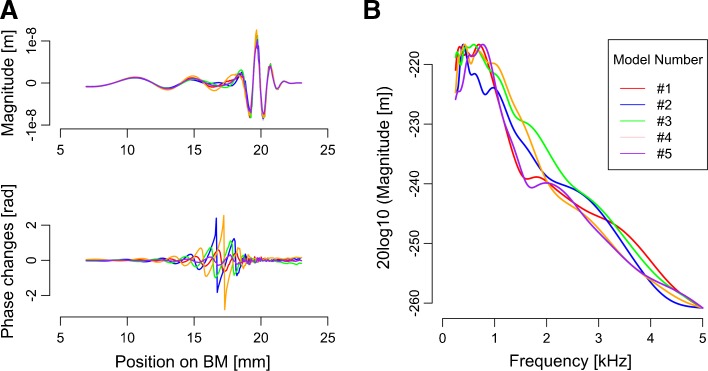
FIG. 9.
A Snapshots of the traveling wave responding to 1 kHz pure tone at 90 ms after the onset of the stimulus (top panel) and phase changes relative to the smooth cochlear output (bottom panel). B Typical simulated CEOAE spectra derived from wavelet analysis. In each graph, five examples calculated from models with a different irregularity profile are shown in different colors.

