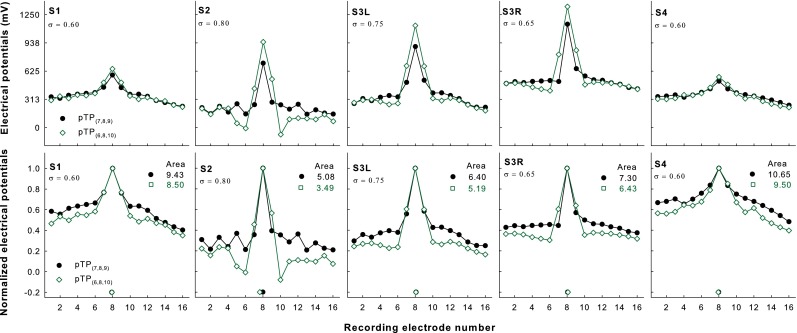
FIG. 1.

Original (upper panels) and normalized EFI patterns (lower panels) as a function of recording electrode for pTP(7,8,9) (filled circles) and pTP(6,8,10) (open squares) in each subject (columns 1–5, respectively). The centroid of each pattern is indicated by the corresponding symbol near the x-axis. The area under the curve of each normalized pattern is shown at the upper right corner. The tested compensation coefficient for each subject is shown at the upper left corner.
