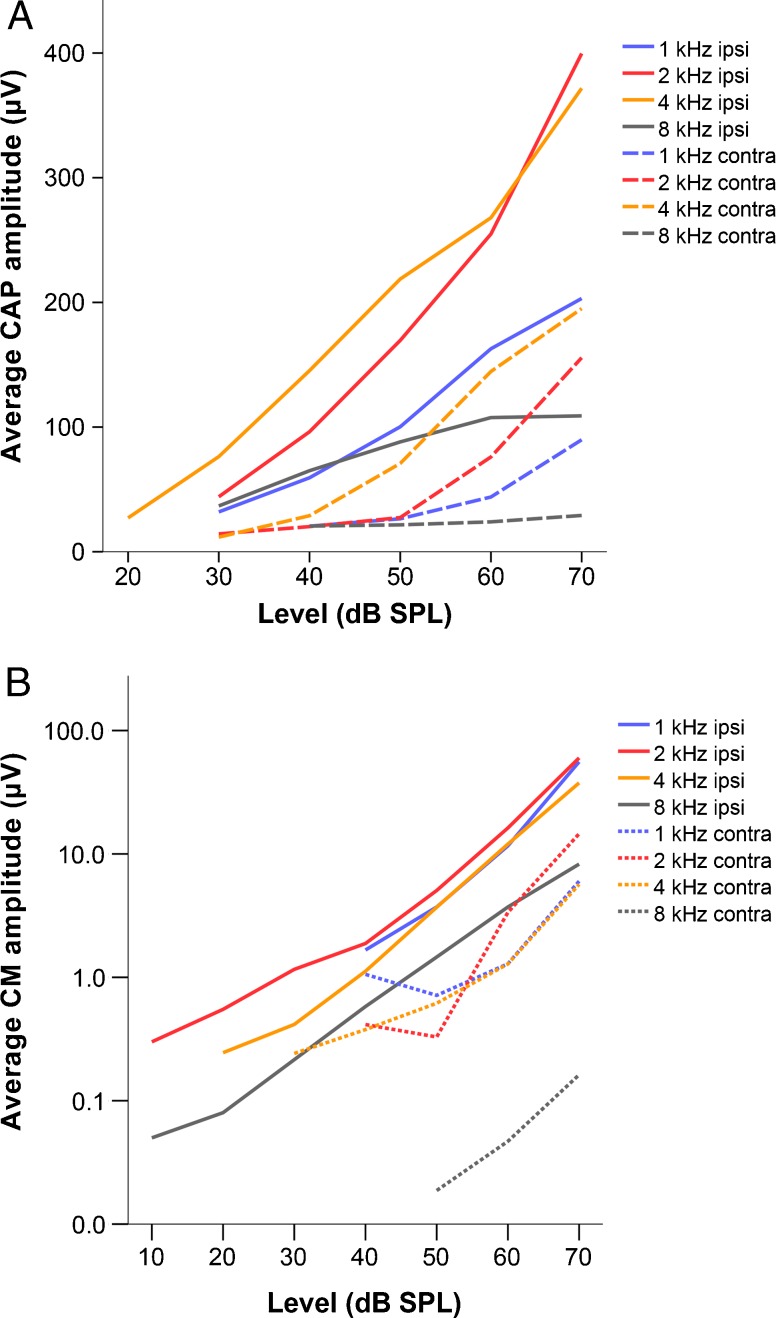
FIG. 1.
Average amplitude (n = 2) in μV of the CAP (panel A, linear scale) and the CM (panel B, logarithmic scale) at different stimulus levels expressed in dB SPL. Each line on the graphs represents a different stimulus frequency. Solid and dashed lines represent responses to ipsi- and contralateral stimulation, respectively.

