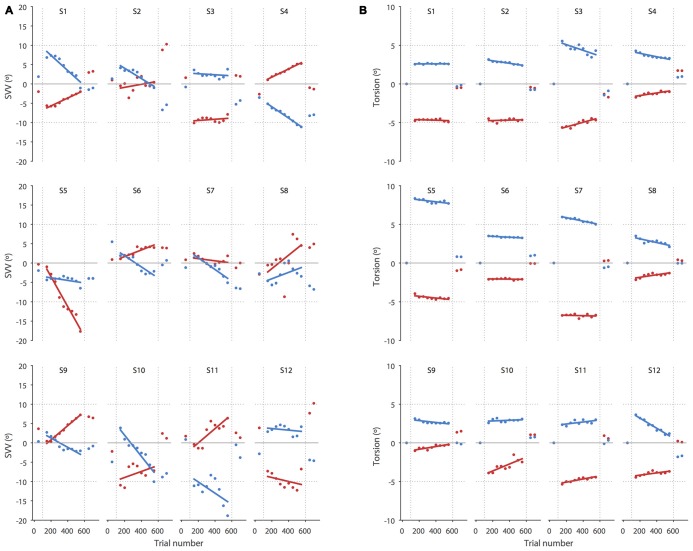
Figure 3.
SVV and torsional position of the eyes during prolonged head tilts are shown in individual subjects. (A) Each point corresponds with the SVV calculated from 100 trials for the right (red) and left (blue) head tilts. The gaps in the data correspond with the first 50 trials in the new head position where SVV estimates were not reliable and were discarded. (B) As in the SVV plot, each point corresponds with the average ocular torsion from blocks of 100 trials for the right (red) and left (blue) head tilts. The gap in the data also corresponds with the first 50 trials that was discarded. Solid lines in both SVV and torsion plots represent linear regressions used to estimate the amount of drift.

