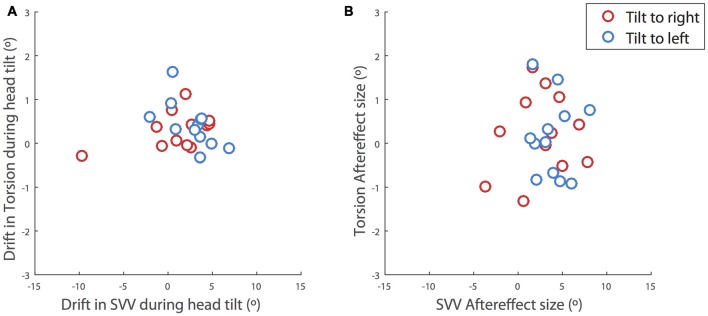
Figure 4.
Correlations between the SVV and ocular torsion. (A) During head tilt and (B) after the head returned to upright position. The drift during head tilt for each subject is estimated as the slope of a linear fit to the SVV responses or ocular torsion. The plots include the values for the right head tilt (red) and the left head tilt (blue). The values for the right head tilt are reversed and shown along with the values for the left head tilt. There is no significant correlation between the drifts of SVV and ocular torsion (r = 0.02, p = 0.6) or their aftereffects (r = 0.2, p = 0.6).

