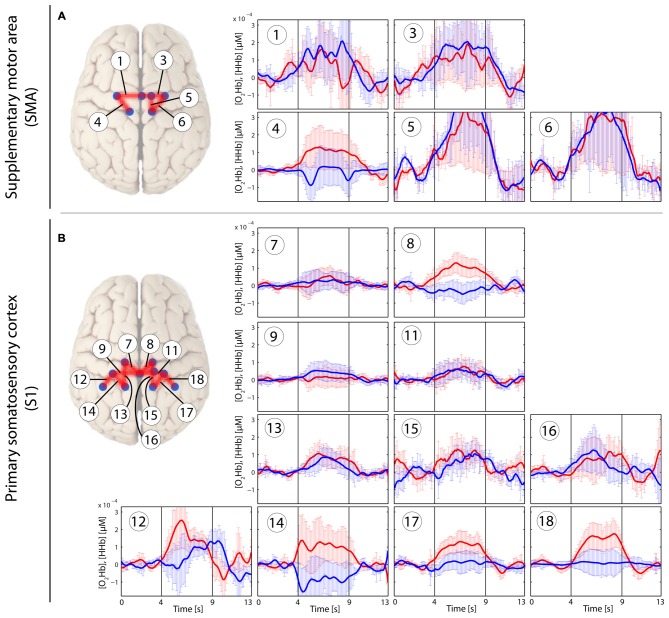
Figure 3.
Stimulus-evoked hemodynamic responses in patients with CLBP elicited by an individual non-painful stimulus with a pressure force for each patient (PAnP). Changes in [O2Hb] (red) and [HHb] (blue) are depicted as changes in the median concentration. The two vertical lines within the graph represent the stimulus on- and offset (duration: 5 s). Error bars represent the standard error of the median. (A) Supplementary motor area (SMA), (B) primary somatosensory cortex (S1). An asterisk represents a statistically significant hemodynamic response (q < 0.05, corrected for multiple comparisons using false discovery rate [FDR]).

