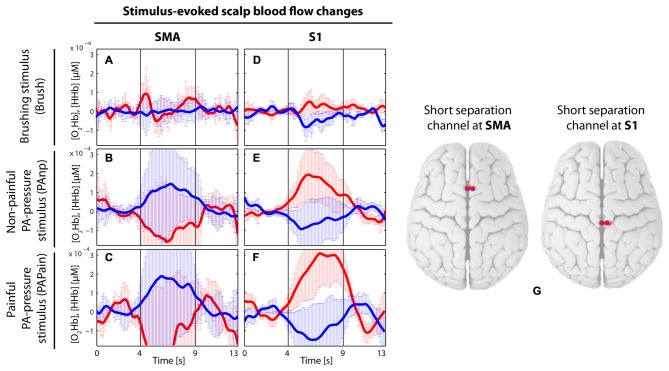
Figure 7.
Visualization of the grand average of evoked hemodynamic changes in the two short-distance channels (channel 2 and 10), which were used in the main analysis to remove the signals from the extracerebral layers (of no interest) by short separation regression. (A–C) Short-distance channel in the supplementary motor area (SMA) in the brushing condition (A) in the non-painful condition (B) and in the painful condition (C). (D–F) Short-distance channel in the primary somatosensory cortex (S1) in the brushing condition (D) in the non-painful condition (E) and in the painful condition (F). Red thick lines display the [O2Hb] median concentration change; blue thick lines display the [HHb] median concentration change; the two vertical lines within the graph represent the stimulus on- and offset (duration: 5 s). Error bars represent the standard error of the median. (G) Visualization of the placement of the two short-distance channels.

