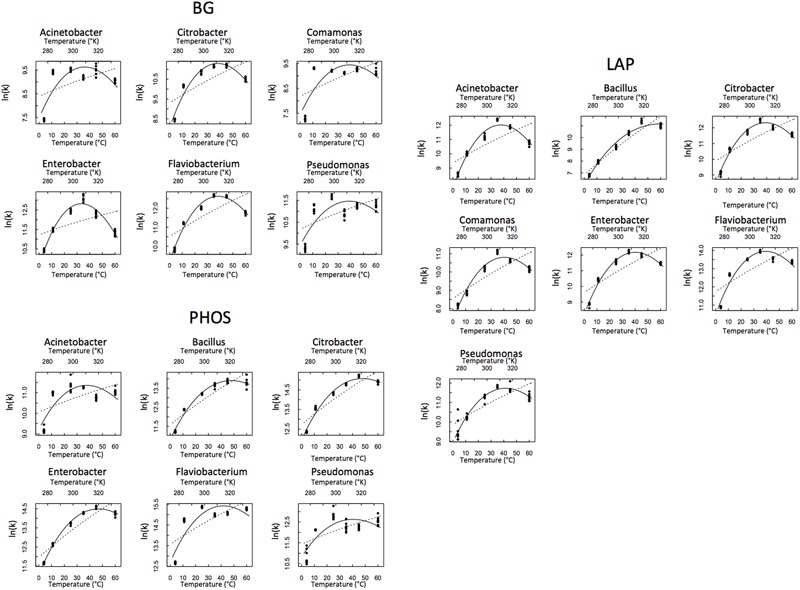
FIGURE 1.

Temperature response of each isolate and enzyme combination. Macromolecular Rate Theory (MMRT) is represented by the solid line and Arrhenius is represented by the dashed line.

Temperature response of each isolate and enzyme combination. Macromolecular Rate Theory (MMRT) is represented by the solid line and Arrhenius is represented by the dashed line.