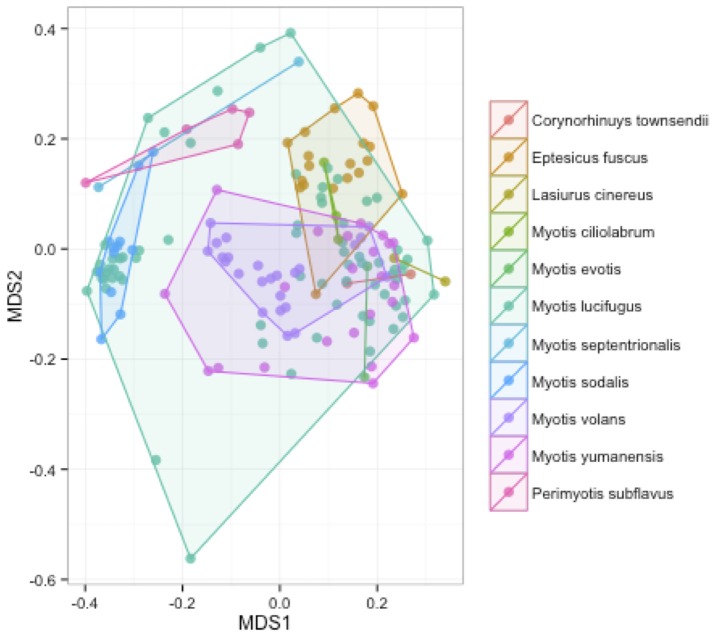
Figure 2.
Differences in community composition of all bat samples by species. An NMDS ordination of a Bray-Curtis dissimilarity matrix of bacterial communities across all bats in the sample set, colored by species (stress = 0.18). A PERMANOVA test showed differences between species were significant (R2: 0.15, p-value < 0.001).

