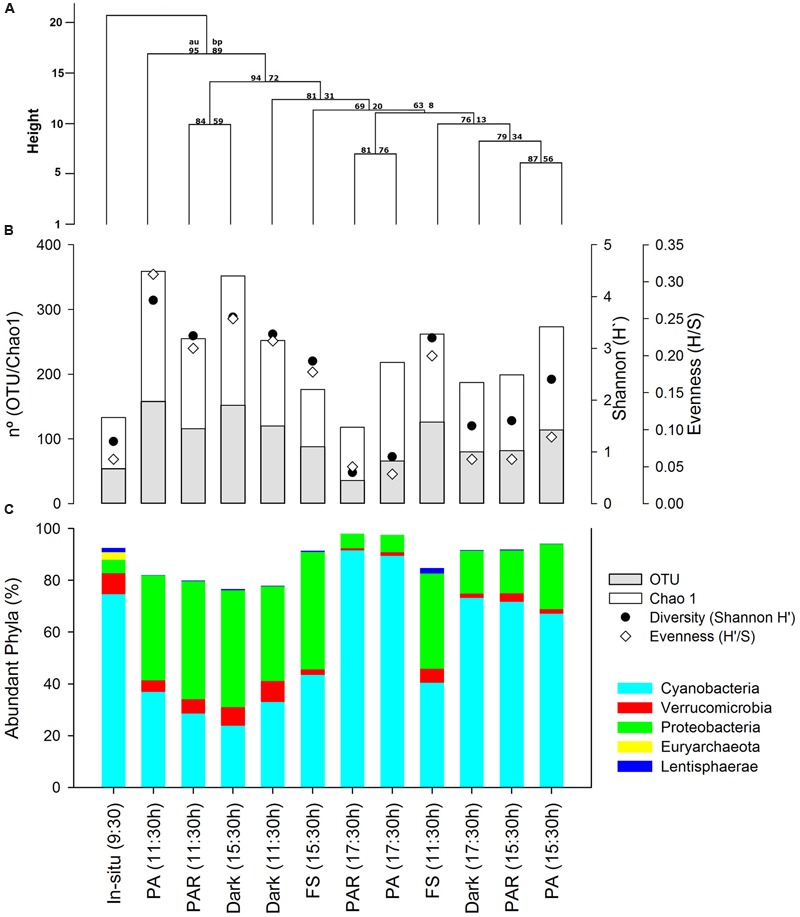
FIGURE 2.

(A) Clustering of active bacteria community structure based on Manhattan distance and average clustering method, also AU (approximately unbiased P-value) and bootstrap values estimated using 1000 resampling are also depicted, (B) Abundant Phyla contribution (%) presented in the same order as clustering analyses results, and (C) plot showing richness, Chao1, Diversity (Shannon H′), and Evenness from the active bacterial community estimated from normalized by resizing pyrolibraries to 1,100 classified sequences.
