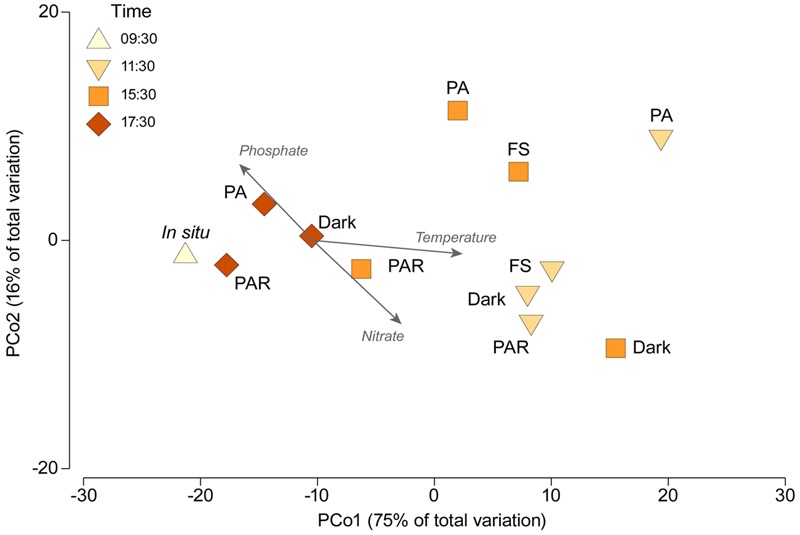
FIGURE 5.

Principal coordinates analysis (PCoA) ordination showing variation in active bacteria community structure associated with the different treatments and time periods. Vectors show those abiotic factors shown to be correlated (r > 0.2) with PC Axis 1 or 2. Treatments acronyms: FS (full sun treatment between 280–700 nm), Dark (cover by aluminum foil and black plastic bags), PAR (400–700 nm, Photosynthetically Active Radiation), and PA (320–700 nm, UVR and PAR).
