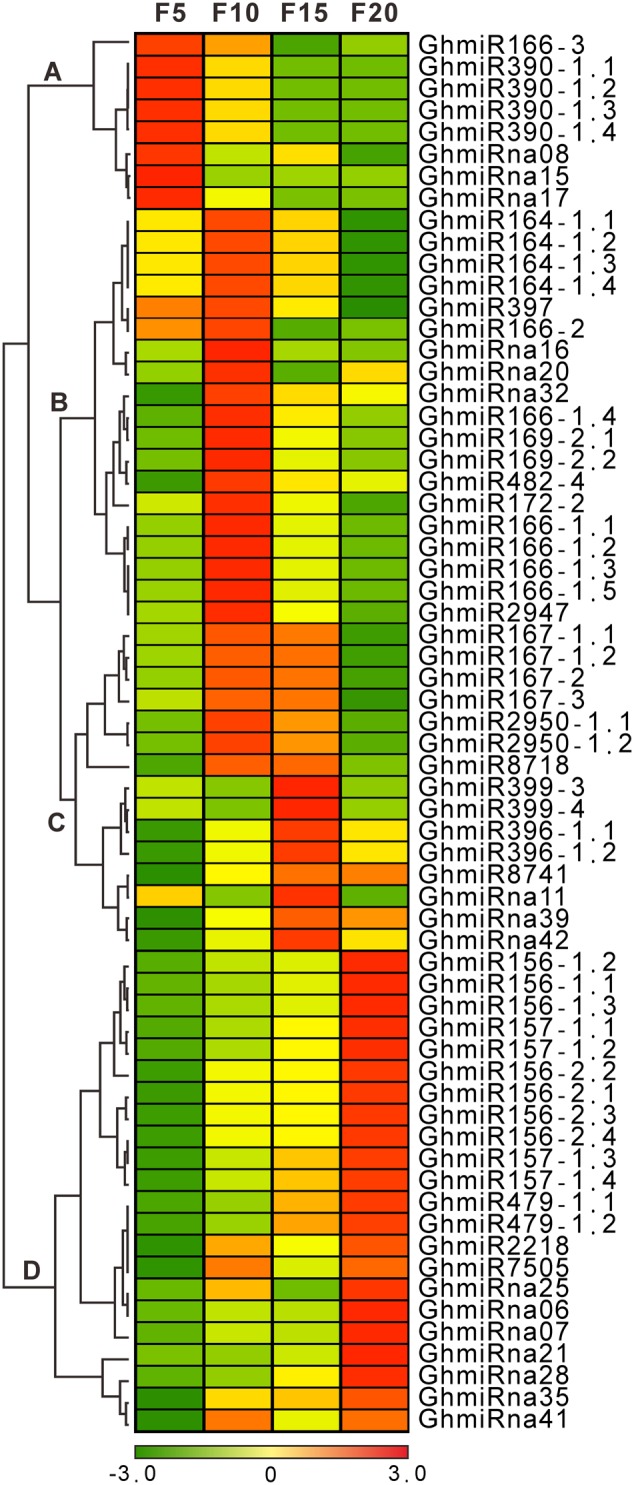
FIGURE 2.

A complete linkage hierarchical cluster analysis of 16 novel and 48 known differentially expressed miRNAs in the cotton fibers was performed by comparing the RPTM of the miRNAs in every library to the average of the four cotton fiber sRNA libraries (5, 10, 15, and 20 DPA). The color indicates the log2-fold change from high (red) to low (green), as indicated in the color scale. On the right are names of the miRNAs, on the left are the classes to which they belong.
