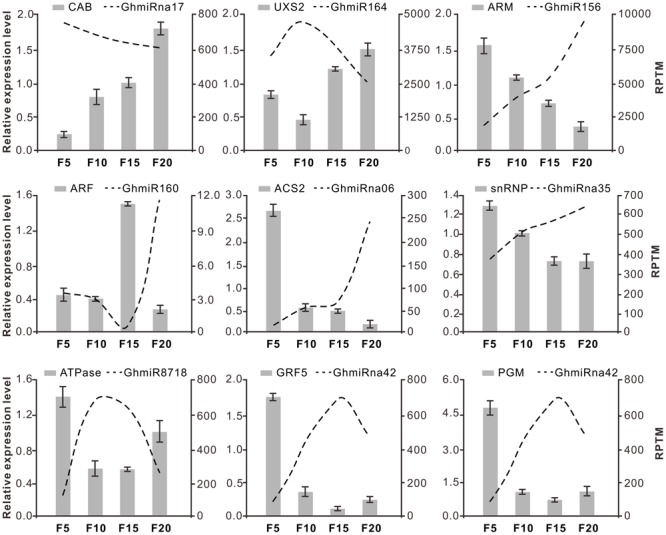
FIGURE 4.

Expression pattern correlation between miRNAs and their target genes. The dotted lines and bars indicate miRNAs and accordingly the target abundance from the qRT-PCR results, respectively, in the four fiber libraries (5, 10, 15, and 20 DPA). The y-axis on the left and right were used to measure the expression levels of target and miRNA, respectively. The data represent the mean values ± SD of three replicates.
