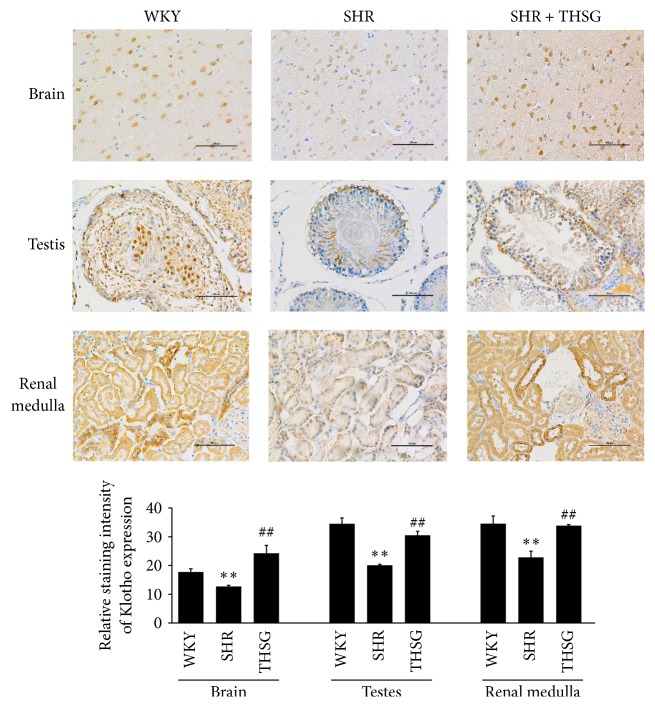
Figure 6.
Klotho expression in the brain, testis, and renal medulla. Immunohistochemical staining for klotho was performed on tissues from 30-week-old WKY rats, 30-week-old SHRs, and SHRs that were treated with THSG. The values in the bar graphs represent the means ± SD; n = 3. ∗∗ P < 0.01 versus the WKY group; ## P < 0.01 versus the SHR group.

