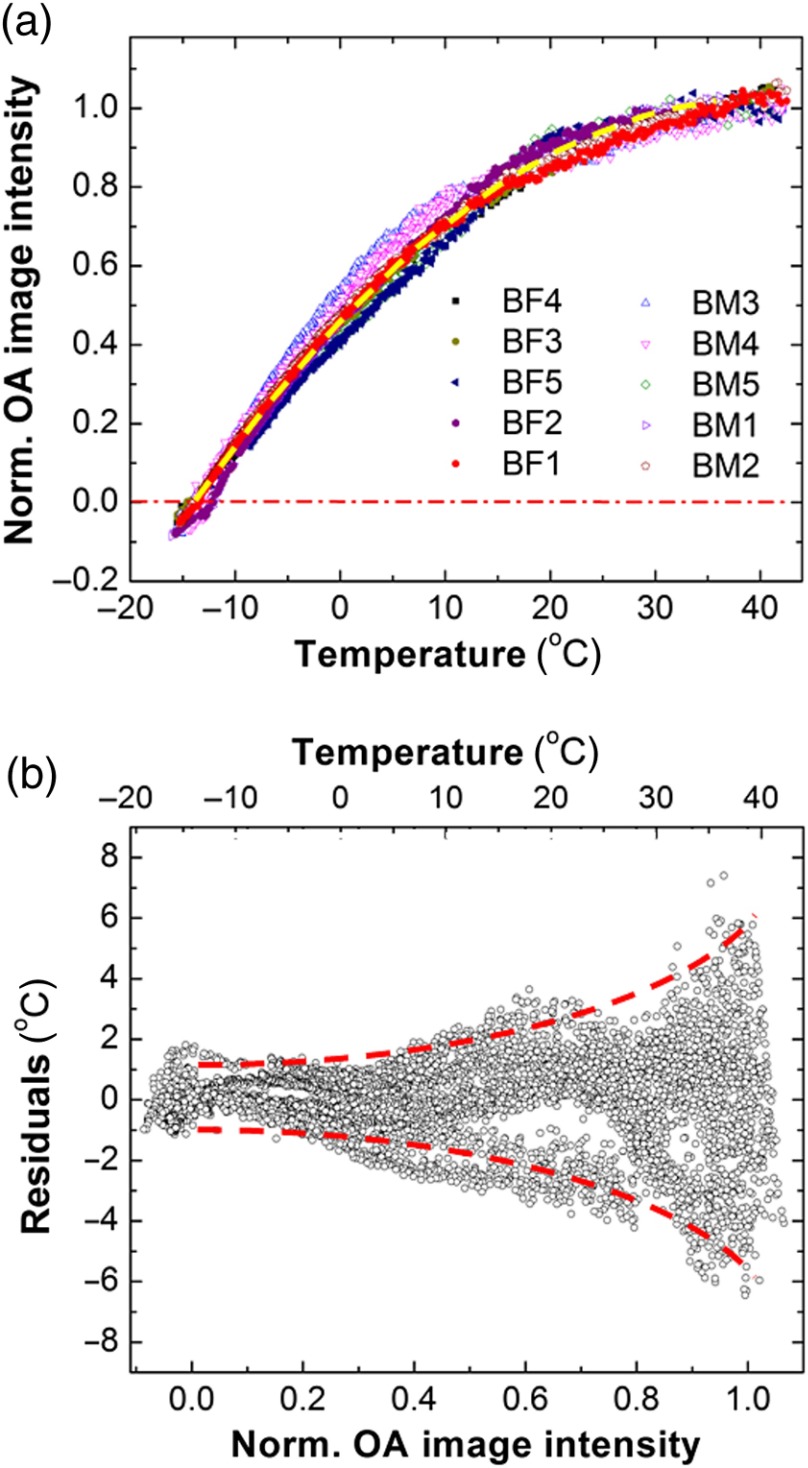
Fig. 1.
(a) Sample-to-sample variation for the ThOR of blood measured for 10 animal subjects. The yellow dashed line is the calibration curve. Red dash-dotted line indicates zero OA image intensity. (b) Accuracy of a single temperature measurement using the OA technique represented by temperature residuals as a function of normalized OA image intensity. The red dashed lines indicate the 95% prediction interval for a single measurement.

