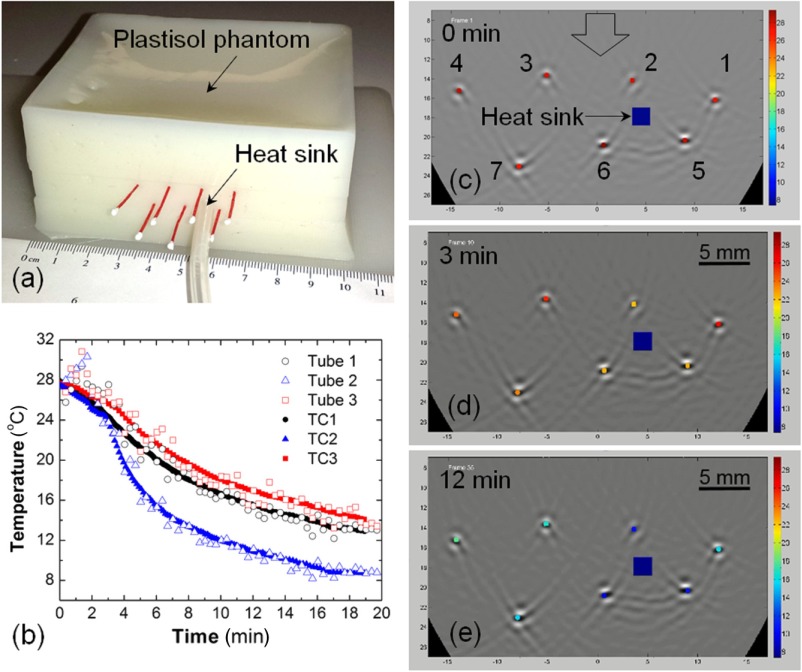
Fig. 3.
(a) A tissue-mimicking PVCP phantom contains ultrathin-wall PTFE tubes with blood samples and a silicone tube with circulated NaCl solution refrigerated down to . (b) Temperature inside the sample tubes as a function of cooling time estimated using OA thermometry with the blood’s ThOR (open symbols) and measured directly by fine gauge thermocouples placed inside the sample tubes (solid symbols). (c–e) Video 1 represented by sample OA frames acquired at the indicated time after the beginning of slow cooling; the temperatures of seven blood samples (circled cross-sections) are graphically illustrated using the “rainbow” color palette, which is scaled linearly from 8°C to 32°C. The blue square marks show the location of the heat sink. The big arrow in (c) marks direction of laser illumination (Video 1, MPEG, 644 KB) [URL: http://dx.doi.org/10.1117/1.JBO.21.11.116007.1].

