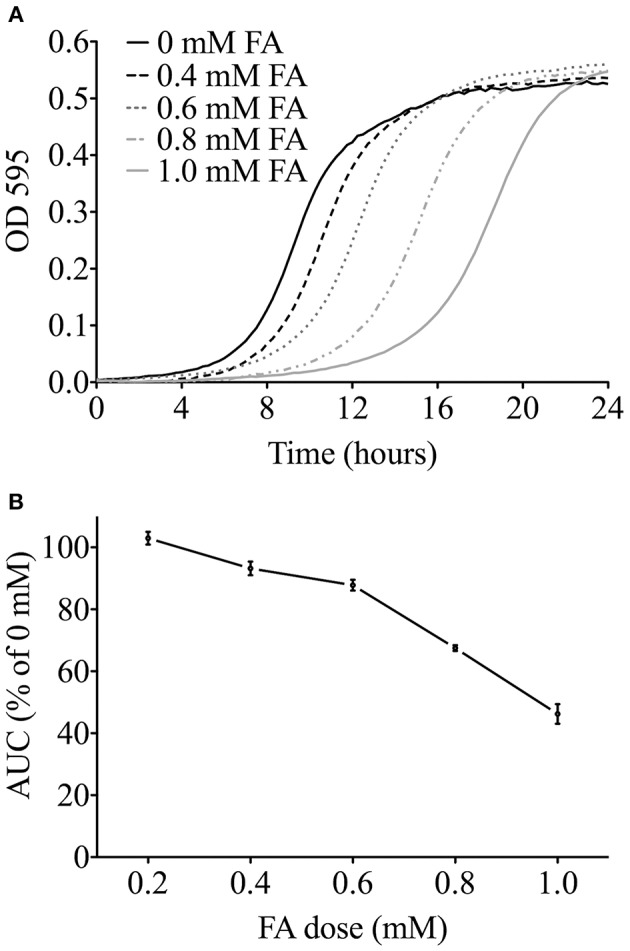
Figure 1.

Determining the FA IC20 for functional screens. (A) Representative growth curves in YPD media for the wild-type BY4743 strain exposed to FA. For clarity, the 0.2 mM FA curve is not shown. (B) The area under the curve (AUC) was determined for each FA dose from three independent growth curve experiments, expressed as the mean and SE, and plotted as a percentage of the untreated control. The FA IC20 was calculated to be about 0.6 mM (600 μM).
