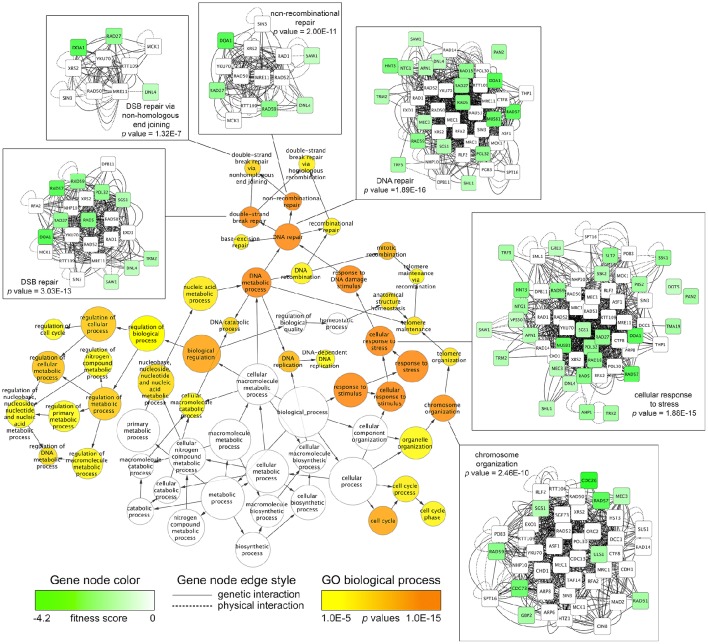
Figure 2.
Network mapping identifies biological processes required for FA tolerance. The Cytoscape software tool was used to map fitness data for FA-sensitive strains onto the S. cerevisiae BioGRID interaction dataset (3.4.130 release). The jActiveModules plugin identified a genetic subnetwork (n = 204) enriched with fitness data, consisting of genetic and physical interactions between sensitive, non-sensitive, and essential genes. Using the subnetwork of 204 genes as input, the BiNGO plugin discovered significantly overrepresented Gene Ontology (GO) Biological Processes (p-value cutoff of 0.001). For clarity, GO categories at a p-value cutoff of 1E-5 (0.00001) are displayed, with all BiNGO output shown in Table S2. The BiNGO output node color (orange to yellow) and size correspond to p-values and number of genes, respectively. Edge arrows illustrate GO term hierarchy. Genetic subnetworks for selected GO categories are shown, where node color (green to white) corresponds to strain fitness score and edge indicates the type of interaction (physical/genetic) between the genes.

