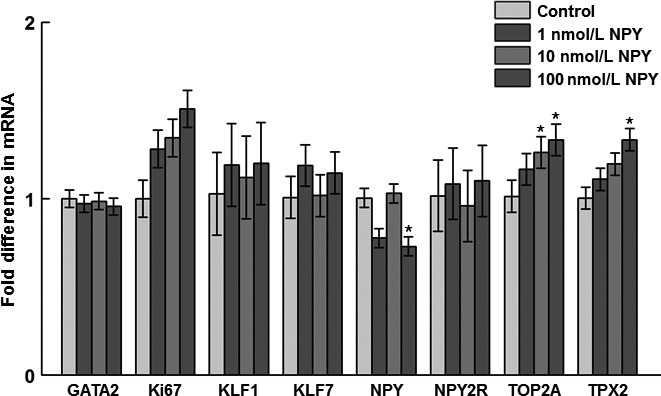
Figure 2.

Effects of NPY treatment on gene expression of preadipocyte and proliferation markers at 12 h posttreatment in the stromal–vascular fraction of cells isolated from abdominal fat of 14‐day‐old broilers. GATA2: GATA‐binding protein 2 (P = 0.98); Ki67: Ki67 (P = 0.09); KLF1: Krüppel‐like factor 1 (P = 0.79); KLF7: Krüppel‐like factor 7 (P = 0.67); NPY: neuropeptide Y (P = 0.02*); NPY2R: NPY receptor subtype 2 (P = 0.88); TOP2A: topoisomerase II alpha (P = 0.04*); TPX2: thioredoxin‐dependent peroxidase 2 (P = 0.03*). Values represent least squares means ± pooled SEM (n = 3). Asterisk denotes a significant difference from the control (P < 0.05; Dunnett's test).
