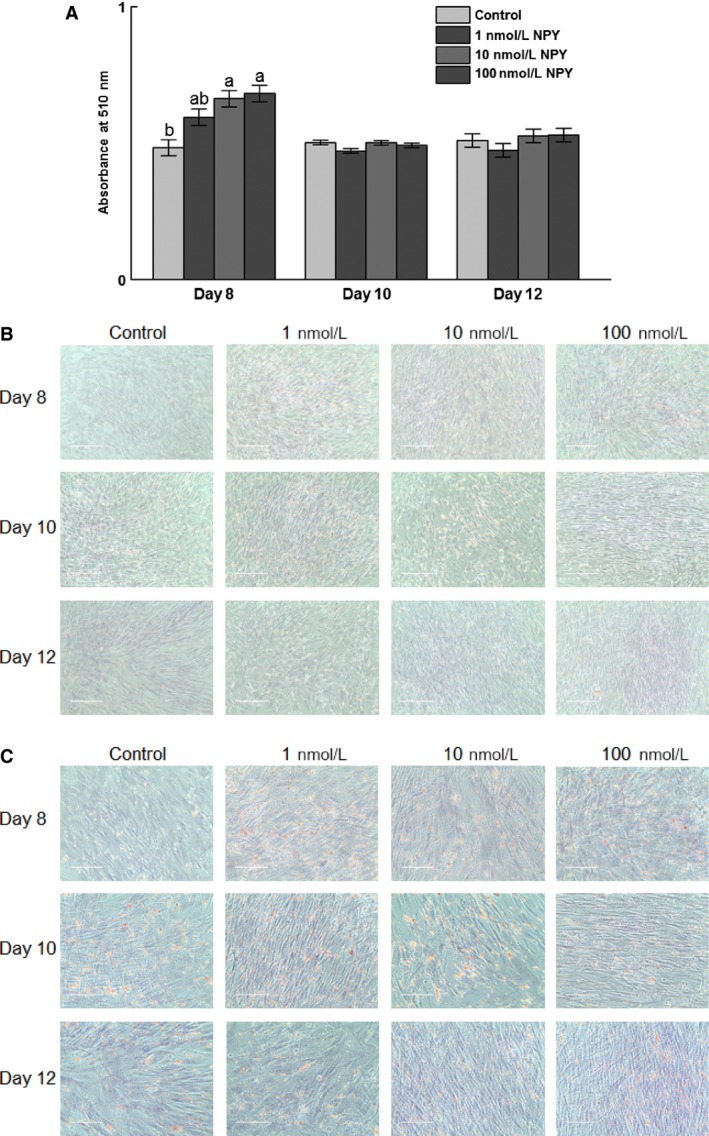
Figure 5.

Oil Red O staining of chicken adipose cells treated with neuropeptide Y (NPY). The stromal–vascular fraction of cells was isolated from abdominal fat of 14‐day‐old broilers and upon confluence induced to differentiate in the presence of 0, 1, 10, or 100 nmol/L chicken NPY. At 8, 10, and 12 days postinduction of differentiation cells were stained with Oil Red O and counterstained with Modified Mayer's Hematoxylin and images captured. (A) Absorbance at 510 nm on days 8, 10, and 12 postinduction of differentiation. (B) Representative micrographs of 0, 1, 10, and 100 nmol/L NPY‐treated cells on days 8, 10, and 12 postinduction of differentiation under 20× magnification. (C) Representative micrographs of 0, 1, 10, and 100 nmol/L NPY‐treated cells on days 8, 10, and 12 postinduction of differentiation under 40× magnification. The scale bar indicates 200 and 100 μm for (B) and (C), respectively. The red color indicates the staining of neutral lipids. Values represent absorbance least squares means ± SEM (n = 3). Different letters indicate a significant difference within day (P < 0.05; Tukey's test).
