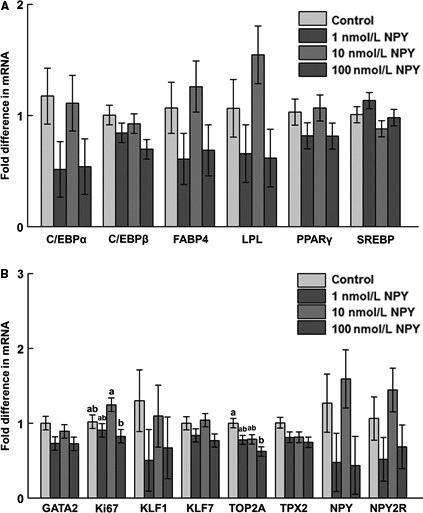
Figure 8.

The mRNA abundance of (A) adipogenesis‐associated factors, (B) preadipocyte and proliferation markers, and neuropeptide Y (NPY) and NPY receptor 2 (NPY2R) at day 12 postinduction of differentiation in chicken adipose cells treated with 0, 1, 10, or 100 nmol/L chicken NPY. (A) C/EBP α: CCAAT/enhancer binding protein α (P = 0.19); C/EBP β: CCAAT/enhancer binding protein β (P = 0.16); FABP4: fatty acid binding protein 4 (P = 0.22); LPL: lipoprotein lipase (P = 0.11); PPAR γ: peroxisome proliferator‐activated receptor γ (P = 0.33); SREBP: sterol regulatory element‐binding protein (P = 0.19); (B) GATA2: GATA‐binding protein 2 (P = 0.17); Ki67: Ki67 (P = 0.04*); KLF1: Krüppel‐like factor 1 (P = 0.53); KLF7: Krüppel‐like factor 7 (P = 0.16); TOP2A: topoisomerase II alpha (P = 0.02*); TPX2: thioredoxin‐dependent peroxidase 2 (P = 0.13); NPY (P = 0.16); NPY2R (P = 0.19). Values represent least squares means ± pooled SEM (n = 3). Bars with different letters within a gene represent a significant difference (P < 0.05; Tukey's test).
