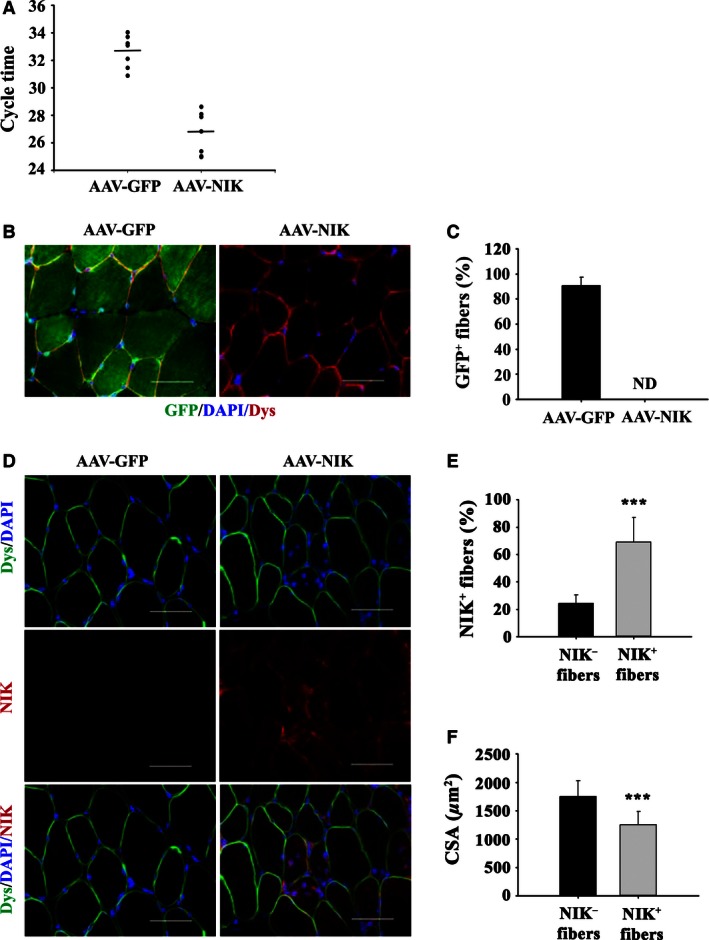
Figure 3.

Overexpressing human NIK in mouse tibialis anterior induces muscle atrophy. (A) NIK mRNA levels presented as cycle times three weeks after injection of AAV‐NIK or AAV‐GFP. (B) Representative immunohistochemical images denoting dystrophin (red), GFP (green) and DAPI (blue) in cross‐sections of the tibialis anterior following administration of AAV‐NIK or AAV‐GFP. Scale bar = 50 μm. (C) Percentage of fibers‐expressing GFP presented as mean ± SD. ND, none detected. (D) Representative immunohistochemical images denoting dystrophin (green), NIK (red) and DAPI (blue) in cross‐sections of the tibialis anterior following administration of AAV‐NIK or AAV‐GFP. Scale bar = 50 μm. (E) Percentage of fibers‐expressing NIK perinuclear staining presented as mean ± SD. (F) Average myofiber cross‐sectional area (CSA) in μm2 of NIK− and NIK+ fibers following administration of AAV‐NIK. Data are presented as mean ± SD. ***Significant effect of AAV‐NIK administration, P < 0.001. N = 8 mice/group.
