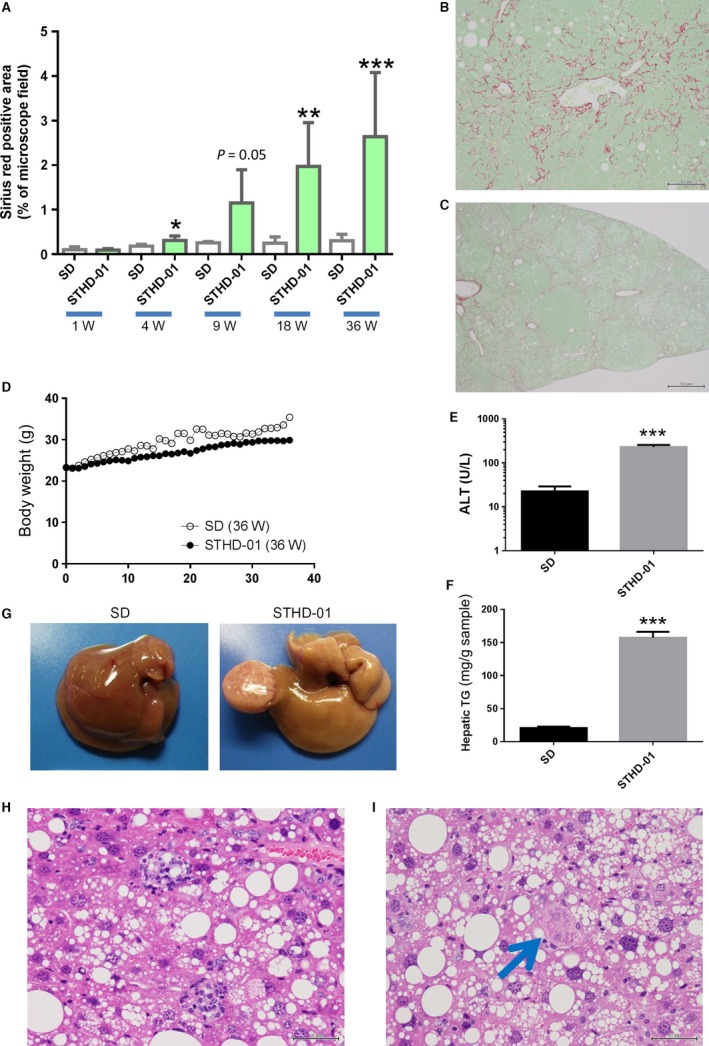
Figure 2.

Changes in mice fed with steatohepatitis‐inducing high‐fat diet (STHD‐01). (A) Percentage of areas positive for Sirius red staining in the livers of mice fed with STHD‐01 for 1 week (n = 3–4), 4 weeks (n = 3–4), 9 weeks (n = 4–5), 18 weeks (n = 5) and 36 weeks (n = 7–9). Sirius red staining of a liver from a mouse‐fed STHD‐01 for 36 weeks (B and C). Perivenular‐pericellular fibrosis and a slender, chicken‐wire pattern (B, ×200); and extensive fibrosis over the entire liver (C, ×40) were noted. Changes in body weight (D), alanine aminotransferase levels (E), hepatic triglyceride levels (F), and macroscopic findings of the liver (G) in mice fed with STHD‐01 for 36 weeks. Hematoxylin and eosin‐stained images of liver tissues in mice‐fed STHD‐01 for 36 weeks (H and I). Large lipid droplets and lobular inflammation (H) and Mallory–Denk body (I) were noted. Bars represent the means ± standard errors. *P < 0.05, **P < 0.01, ***P < 0.001 compared to the SD group (Student's t‐test).
