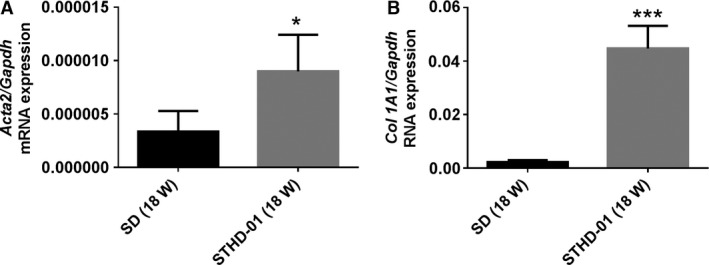
Figure 7.

Expression levels for key genes in the livers of mice fed with steatohepatitis‐inducing high‐fat diet (STHD‐01) or standard diet (SD) for 18 weeks. Bars represent the means ± standard errors. *P < 0.05, **P < 0.01, ***P < 0.001 compared with the SD group (Student's t‐test).
