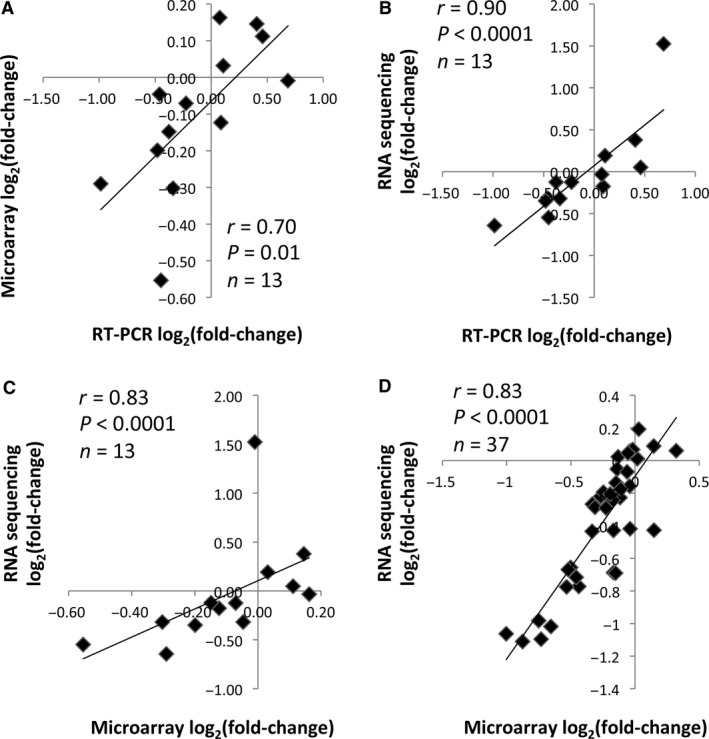
Figure 1.

Correlations between mRNA sequencing, microarray and RT‐PCR. (A) Correlation between the change in expression of 13 genes (see “Methods”) analyzed by RT‐PCR and microarray. (B) Correlation between the change in expression of 13 genes analyzed by RT‐PCR and mRNA sequencing. (C) Correlation between the change in expression of 13 genes analyzed by microarray and mRNA sequencing. (D) Correlation between the change in expression of 37 immune cell markers (see Table 2) analyzed by microarray and mRNA sequencing. The change (post baseline) was calculated from the average expression from five subjects from the exercise intervention. Spearman's rho correlations were performed.
