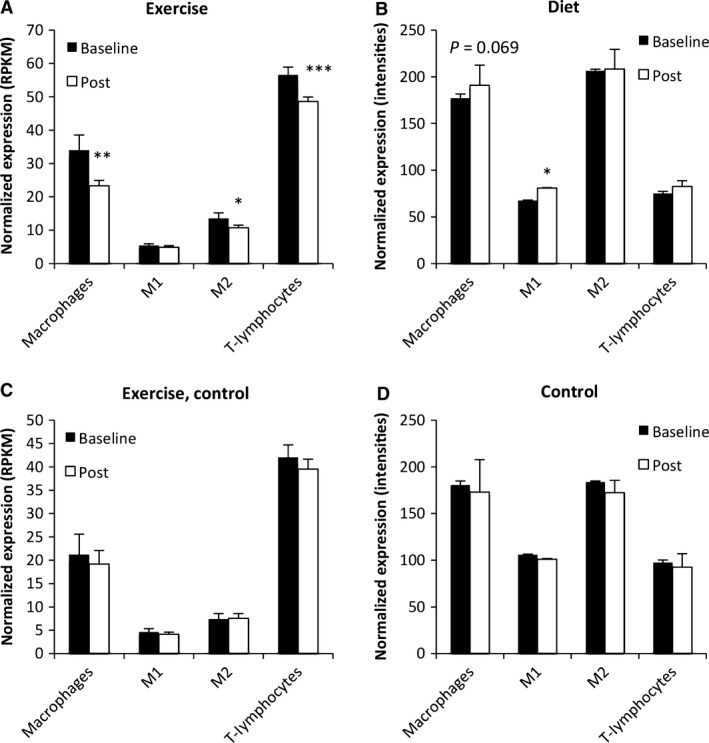
Figure 4.

The change in expression of immune cell markers in response to exercise and diet. (A) The average expression of markers for adipose tissue macrophage, M2‐like macrophages and T cells were reduced after exercise. (B) The average expression of markers for adipose tissue M1‐like macrophages was increased after energy restriction. (C) No alteration in expression of immune cell markers was observed in lean control subjects after exercise. (D) No alteration in expression of immune cell markers was observed in control subjects. Data represent means ± SEM. *P < 0.05, **P < 0.01, and ***P < 0.001 baseline versus 12 weeks. RPKM = Reads Per Kilobase of transcript per Million mapped reads; ni = normalized intensities.
