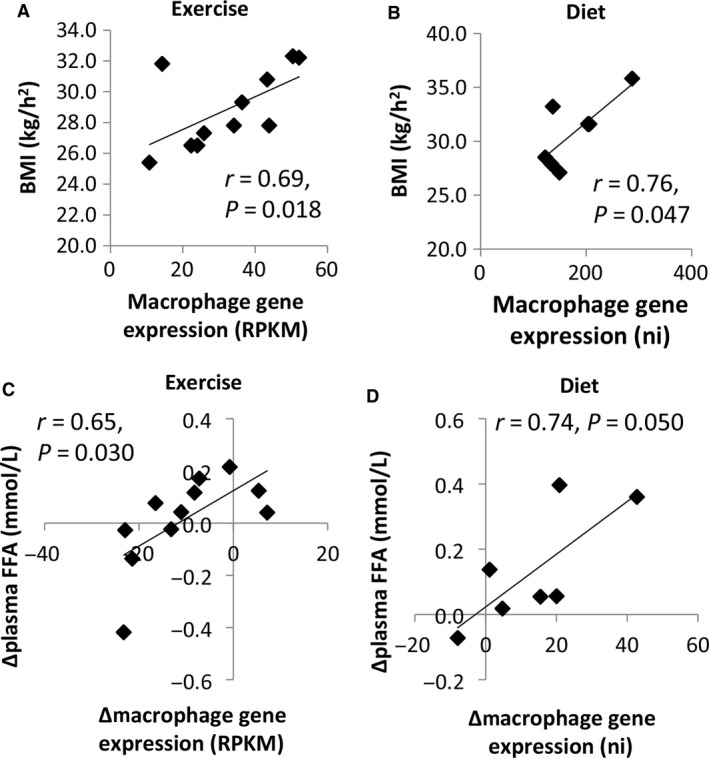
Figure 9.

Macrophage markers correlate with BMI and FFA in both the exercise and diet groups. (A) BMI correlated with adipose tissue macrophage expression at baseline in the exercise group. (B) BMI correlated with adipose tissue macrophage expression at baseline in the diet group. (C) The change in gene expression (12 weeks minus baseline) of adipose tissue macrophages correlated with the change in plasma FFA concentrations in the exercise group. (D) The change in gene expression of adipose tissue macrophages correlated with the change in plasma FFA concentrations in the diet group. RPKM = Reads Per Kilobase of transcript per Million mapped reads, ni = normalized intensities.
