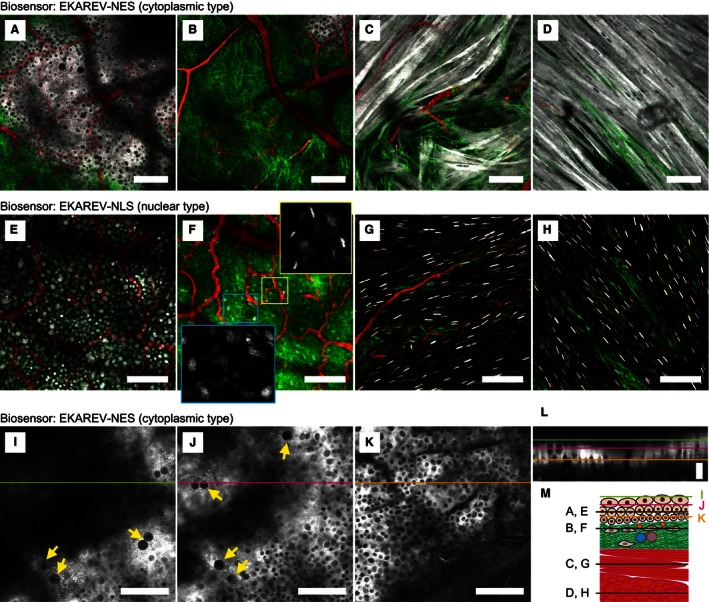
Figure 2.

Multidimensional imaging of the whole bladder wall of live mouse by two‐photon excitation microscopy. (A–H) Merged images of cyan fluorescent protein (CFP) (gray scale), second harmonic generation (green) and Qtracker 655 (red) by multidimensional imaging of the whole mouse bladder wall expressing EKAREV‐NES (A–D, and Video S1) and EKAREV‐NLS (E–H, and Video S2). Magnified images of the boxed regions show only CFP (gray scale). (I–K) Multidimensional CFP images (gray scale) of the urothelium expressing EKAREV‐NES with a 1.4 digital zoom. Umbrella cells with large nuclei are indicated by arrows. Scale bar = 100 μm (A–K). (L) A reconstructed xz‐plane image at the lines drawn in I–K. The image is extended along the z‐axis to 240% for better visibility. The colors of bars indicating the imaging planes correspond to those in I–K. Scale bar = 10 μm. (M) A schematic diagram of the whole bladder wall with each imaging plane indicated.
