Figure 5.

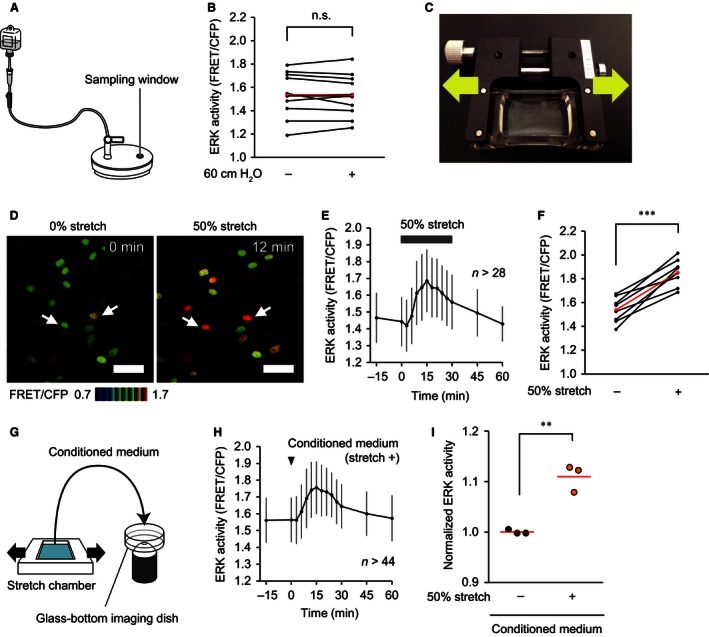
Extracellular signal‐regulated kinase (ERK) activation by stretch‐evoked release of specific molecules in TRT‐HU1 cells. (A) A schematic diagram of the handmade device used to apply hydrostatic pressure to TRT‐HU1 cells. (B) Summary of measured ERK activity in TRT‐HU1 cells at baseline (0 min) and 30 min after application of 60‐cm H2O hydrostatic pressure (n = 12). The ERK activity in each experiment and the mean values are indicated in black and red, respectively. n.s., not significant by a paired Student's t‐test. (C) A photograph of the uniaxial stretch experiment. A silicon chamber containing confluent TRT‐HU1 cells was uniaxially stretched with a manual extension device. (D) Representative ratio images of stretch‐evoked ERK activation in TRT‐HU1 cells (Video S5). Two representative cells are marked (arrows). Scale bar = 50 μm. (E and F) A representative graph (E) and summary (F) of the change in ERK activity of TRT‐HU cells by 30‐min 50% uniaxial stretch (n = 8). n, number of cells analyzed at each time point (E). ERK activity was measured at baseline (0 min) and 15 min after application of uniaxial stretch (F). ERK activity in each experiment and the mean values are indicated in black and red, respectively (F). (G) A schematic diagram of the medium treatment experiment. During imaging of TRT‐HU1 cells, the other TRT‐HU1 cells were treated with 50% uniaxial stretch for 1 min. The culture medium of the cells under observation was removed, and replaced with the conditioned medium of the stretched cells. (H) A representative graph of the change in ERK activity of TRT‐HU1 cells by treatment with the conditioned medium of the stretched cells. n, number of cells analyzed at each time point. (I) Summary of the relative change in ERK activity of TRT‐HU1 cells between baseline (0 min) and 15 min after addition of conditioned medium of the stretched cells and nonstretched cells (n = 3 for each). Circles and red lines indicate normalized ERK activity in each experiment and the mean values, respectively. **P < 0.01, ***P < 0.001 compared to the control by a paired Student's t‐test.
