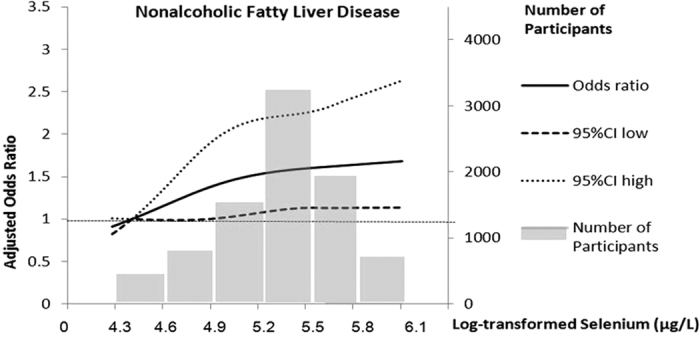
Figure 1. Odds ratio of nonalcoholic fatty liver diseases by log-transformed plasma selenium concentrations.

Lines represent odds ratios (95% CI) based on restricted cubic splines for log-transformed plasma selenium concentrations with knots at the 5th, 50th and 95th percentiles. Odds ratios were estimated using a logistic regression model after adjustment for age, gender, BMI, current smoking status, physical activity, waist circumference, systolic blood pressure, diastolic blood pressure, fasting plasma glucose, post-loading plasma glucose, HOMA-IR, lipid profiles, estimated glomerular filtration rate and C-reactive protein; P for linear <0.01. Bars represent the numbers of participants, 6 equally sized bins were selected from the 1st to the 99th percentiles of log-transformed selenium distribution.
