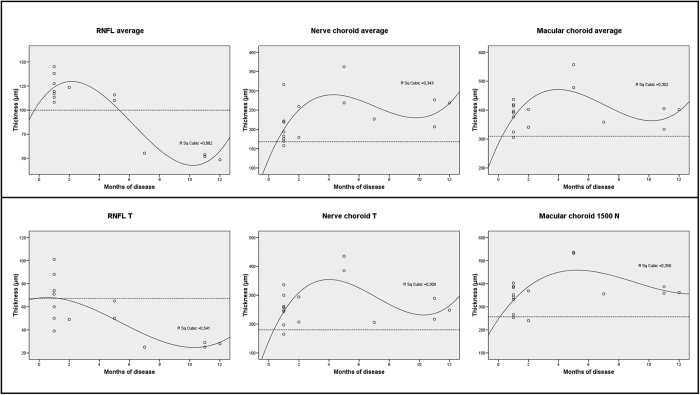
Figure 4. Scatter plots with cubic regression lines, showing the relationship between disease duration in the first 12 months and average measurements of retinal nerve fiber layer (RNFL), nerve and macular choroid thickness (top) and measurements corresponding to the papillomacular bundle region, in particular temporal RNFL, nerve choroid temporal and macular choroid nasal thickness (bottom).
Dotted lines indicate mean values of the healthy subjects.

