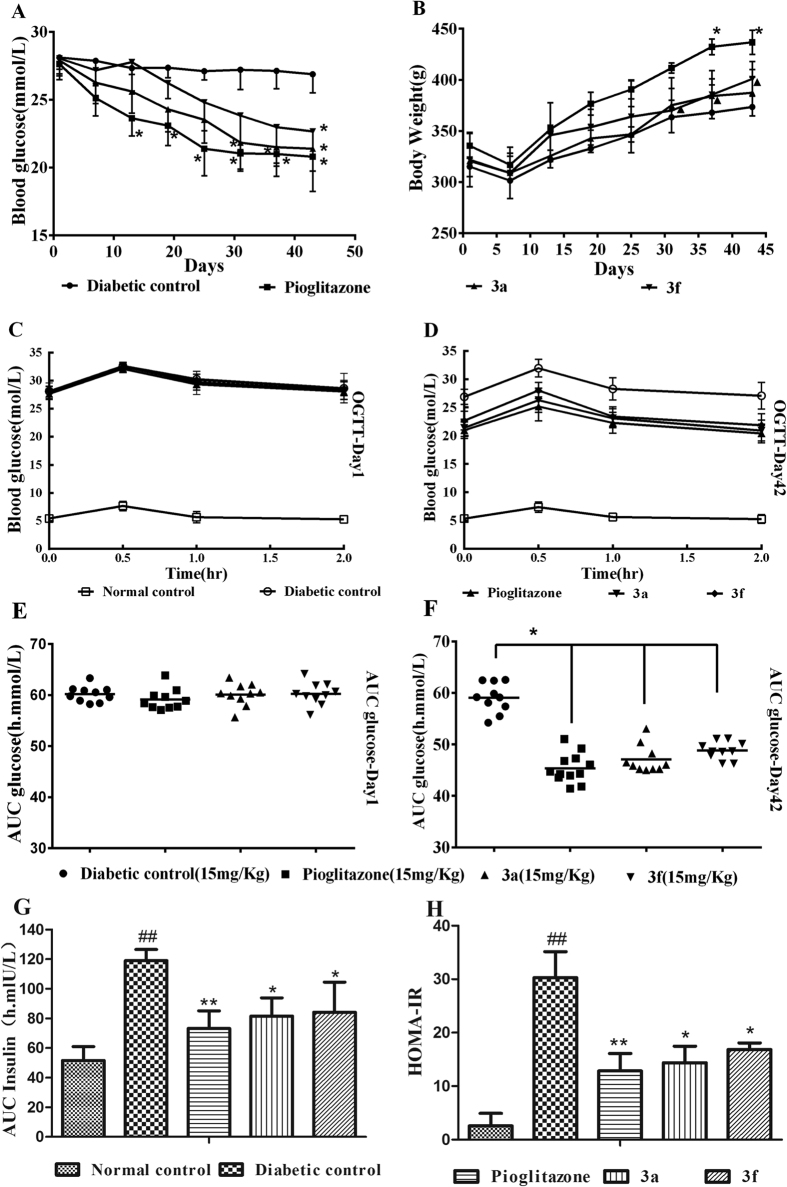
Figure 5.
(A,B) Effects of compound 3a, compound 3f, and pioglitazone on the blood glucose levels and body weights in HFD-STZ-induced diabetic rats. (C–F) Effects of compounds 3a and 3f on the oral glucose tolerance test in Wistar albino rats. (C) Blood glucose levels on Day 1. (D) Blood glucose levels on Day 42. (E) AUC for glucose on Day 1. (F) AUC for glucose on Day 42. (G) AUC for insulin during OGTT on Day 42. (H) Homeostasis model assessment of insulin resistance (HOMA-IR) index on Day 45. The data are presented as the means ± SD; *P < 0.05 versus the diabetic control, **P < 0.01 versus the diabetic control, ##P < 0.01 versus the normal control, ▴P < 0.05 versus pioglitazone.

