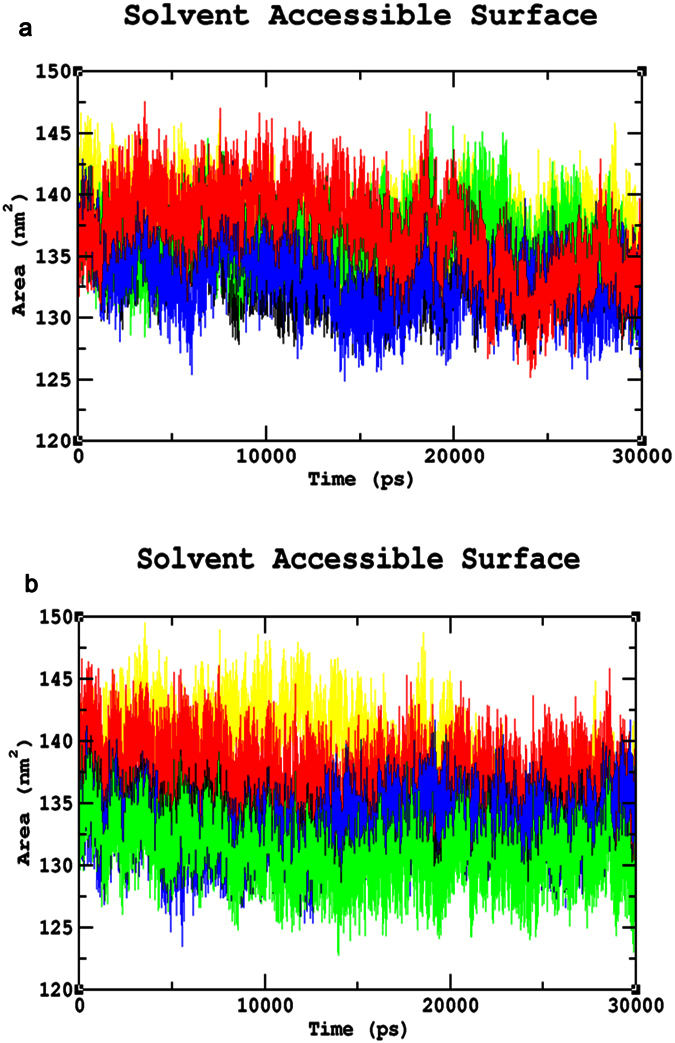
Figure 6.

Solvent-Accessible Surface Area analyses (SASA) (a) SASA of Common mutants and native mutants. Color Scheme Native (Black), p.S188F (Red), p.N126D (Blue), p.V68M (Green), and p.I48T (Yellow). (b) SASA of the unique mutants and native. Color Scheme Native (Black), p.S179N (Red), p.Q307P (Blue), p.R246L (Green), and p.S135T (Yellow).
