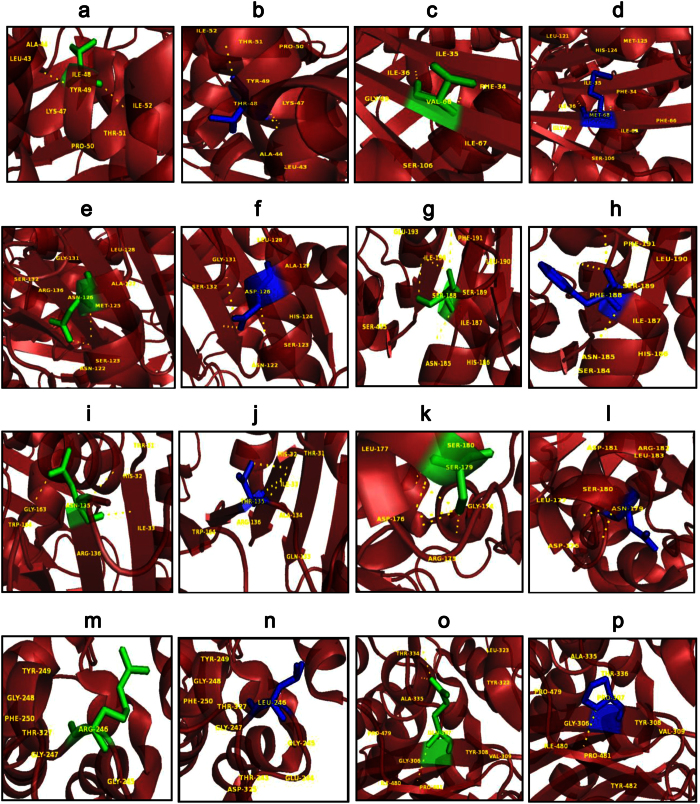
Figure 7. PyMOL visualization to compare the native and mutant amino acids.
(a) native I48, (b) mutant p.I48T, (c) native V68, (d) mutant p.V68M, (e) native N126, (f) mutant p.N126D, (g) native S188, (h) mutant S188F, (i) native N135, (j) mutant p.N135T, (k) native S179, (i) mutant p.S179N, (m) native R246, (n) mutant p.R246L, (o) native Q307, (p) mutant p.Q307P. This visualization helps to predict the possible changes occurred upon mutation. Major differences observed are discussed below. In p.I48T, there is gain of polar contacts with Tyr49 and Leu43. Gain of contact with a hydrophobic amino acid such as Leucine further changes the orientation of the amino acid. P.V68M, where there the mutant (M) is larger than the native (V). In p.S188F, there is loss of polar contact indicating loss of stability. Loss of contacts are also observed in p.N125T mutant. Arginine (R) at 246th position is in surface, further substitution with hydrophobic amino (L), destabilizes the protein structure. In mutant p.Q307P, a larger amino acid is substituted with much smaller Proline (P) and forming contacts with Tyr 482 (polar amino acid) changes the orientation of the mutant amino acid.

