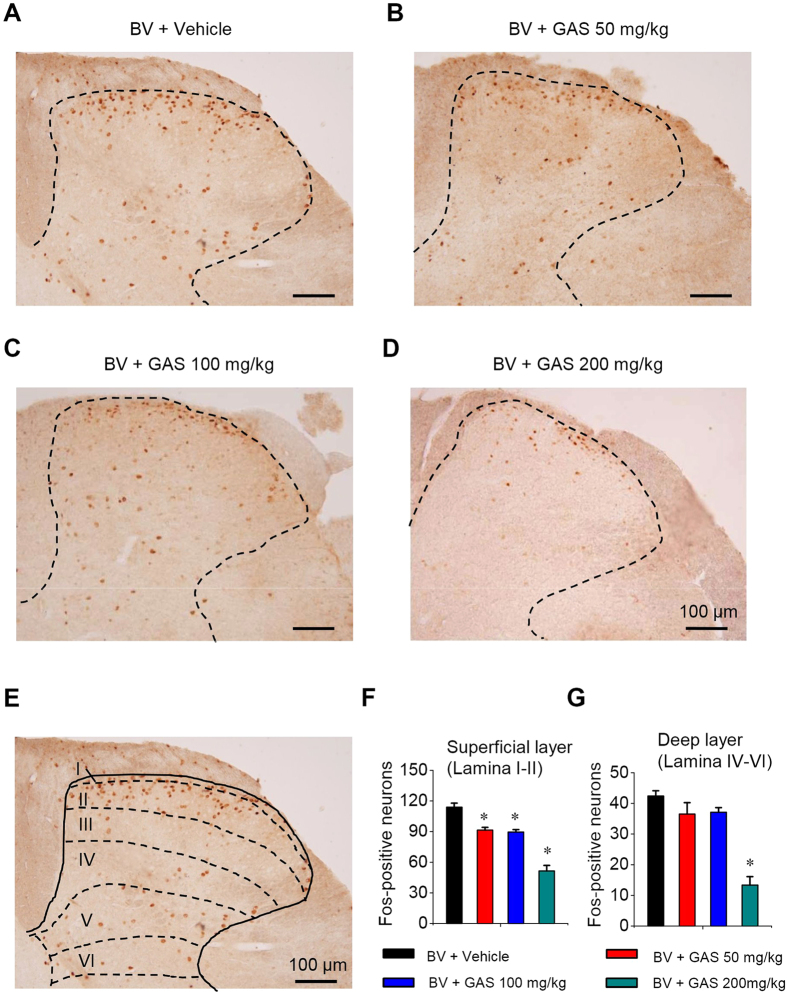
Figure 3. GAS inhibited spinal c-Fos expression induced by intraplantar bee venom injection.
(A–D) Typical examples of the induction of c-Fos protein in the spinal dorsal horn induced by bee venom injection in vehicle-treated mice (A) and in groups treated with different doses of GAS (B–D). (E) Schematic diagram showing the counting of c-Fos-positive cells in different layers of the spinal dorsal horn. (F,G) Quantitative summary showing the inhibition of c-Fos expression in both the superficial (F) and deep layer of the spinal dorsal horn by GAS in a dose-dependent manner (n = 3, P < 0.05). All data are represented as mean ± S.E.M. Scale bar represents 100 μm in (A–E). *P < 0.05.

