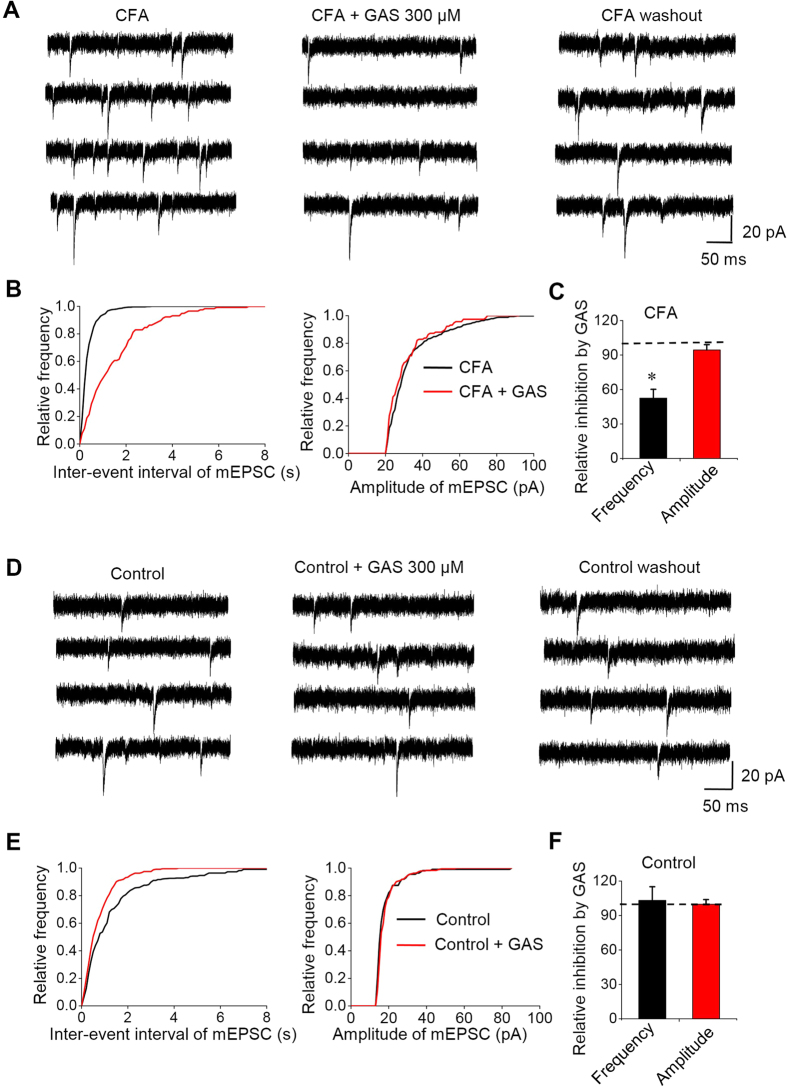
Figure 5. GAS-induced inhibition of mEPSCs recorded from CFA-inflamed mice but not control mice.
(A) Four consecutive mEPSCs traces before (left), during the action of GAS (300 μM) (middle), and after the washout of GAS (right) from the CFA-inflamed slice. (B) Cumulative distributions of the inter-event interval (left) (n = 7, P < 0.05) and amplitude (right) (n = 7, P > 0.05) of mEPSCs before (black line) and during (red line) the action of GAS on the CFA-inflamed slice. (C) Quantitative summary showing the inhibitory rate of GAS on the frequency (n = 7, P < 0.05) and amplitude (n = 7, P > 0.05) of mEPSCs from the CFA-inflamed slice. (D) Four consecutive mEPSCs traces before (left), during the action of GAS (300 μM) (middle), and after washout of GAS (right) from the control slice. (E) Cumulative distributions of the inter-event interval (left) and amplitude (right) of mEPSCs before (black line) and during (red line) the action of GAS on the control slice (n = 7, P > 0.05). (F) Quantitative summary showing the effect of GAS on the frequency and amplitude of mEPSCs from control slice (n = 7, P > 0.05). All data are represented as mean ± S.E.M. *P < 0.05.

