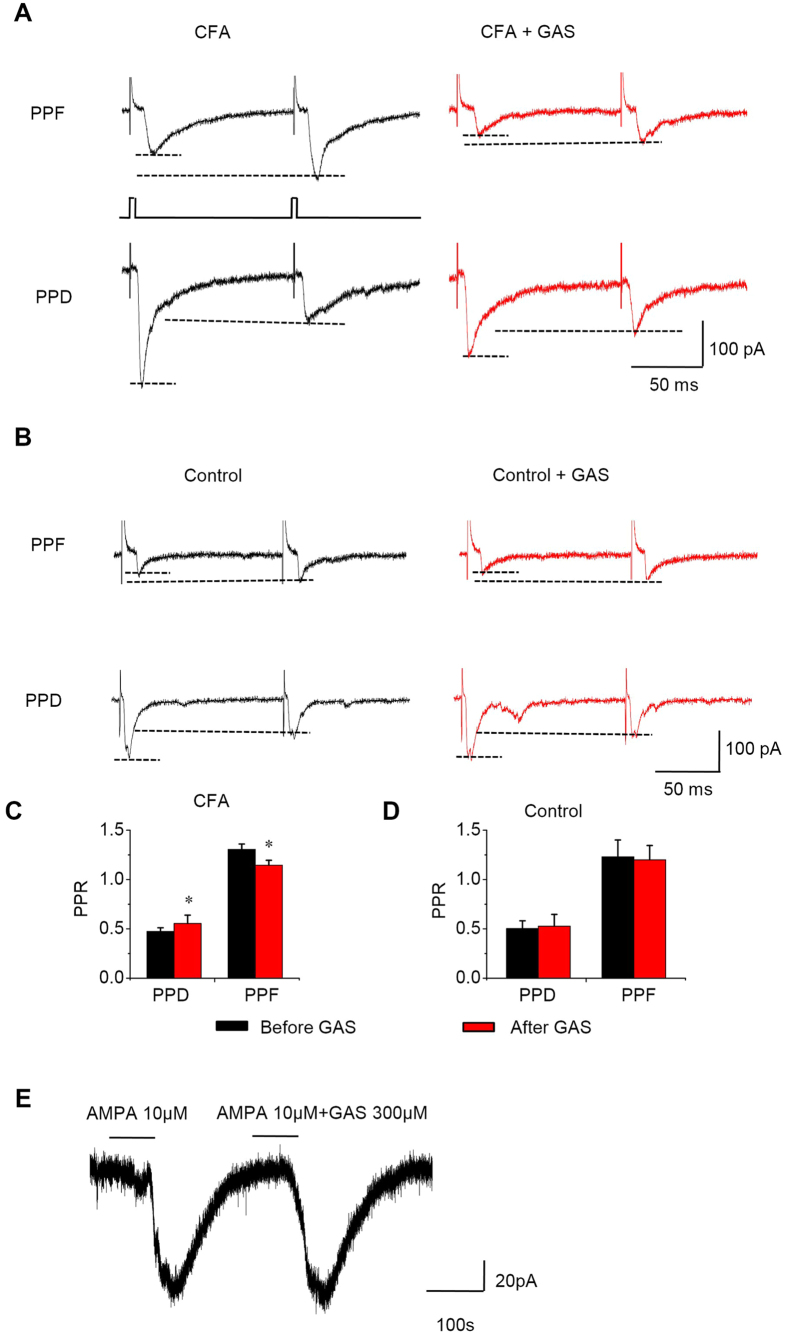
Figure 6. Analysis of the action of GAS on the paired-pulse facilitation (PPF) and paired-pulse depression (PPD) of C-eEPSCs induced by pairs of stimuli at an inter-stimulus interval of 110 ms as well as AMPA response in spinal lamina I neurons from control and CFA-inflamed mice.
(A,B) Traces of typical recordings showing PPF or PPD prior to (left, black) and during GAS application (right, red) from CFA-inflamed (A) and control mice (B). (C,D) Quantitative analysis of the paired-pulse ratio prior to and during GAS action from CFA-inflamed (C) and control mice (D). Note that the PPR displayed a significant change following GAS application in CFA-inflamed mice (n = 10, P < 0.05), but this change did not occur in control mice (n = 10, P > 0.05). (E) The effect of GAS (300 μM) on the response of lamina I neurons from CFA-inflamed mice (n = 4) to AMPA (10 μM) application (P > 0.05). The horizontal bars shown above the record indicate the period of time during which the drugs were applied. All data are represented as mean ± S.E.M. *P < 0.05.

