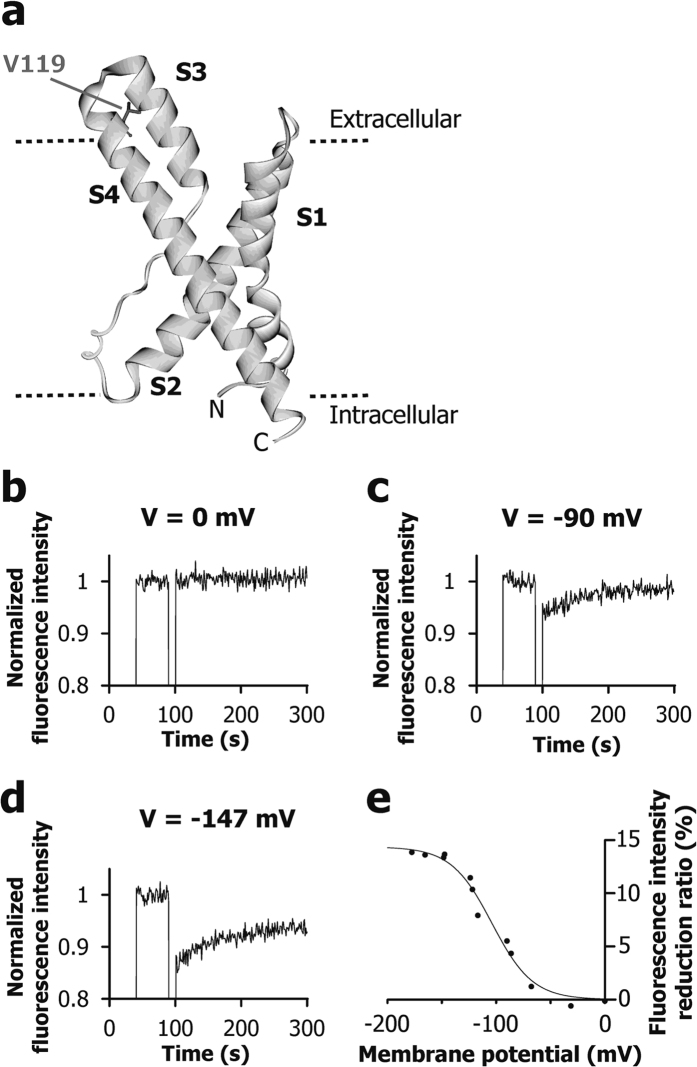
Figure 2. Fluorescence analysis of mBBr to examine voltage-dependent conformational changes of VSD.
(a) The location of V119, which was mutated to Cys with the mBBr modification. (b–d) Fluorescence time courses of mBBr attached VSD on the liposomes with three different membrane potentials: (b) 0 mV, (c) −90 mV, and (d) −147 mV. (e) Relationship between the estimated membrane potential by di-4-ANEPPS analysis and the fluorescence intensity reduction ratio of mBBr at 100 s (upon the formation of the membrane potential).

