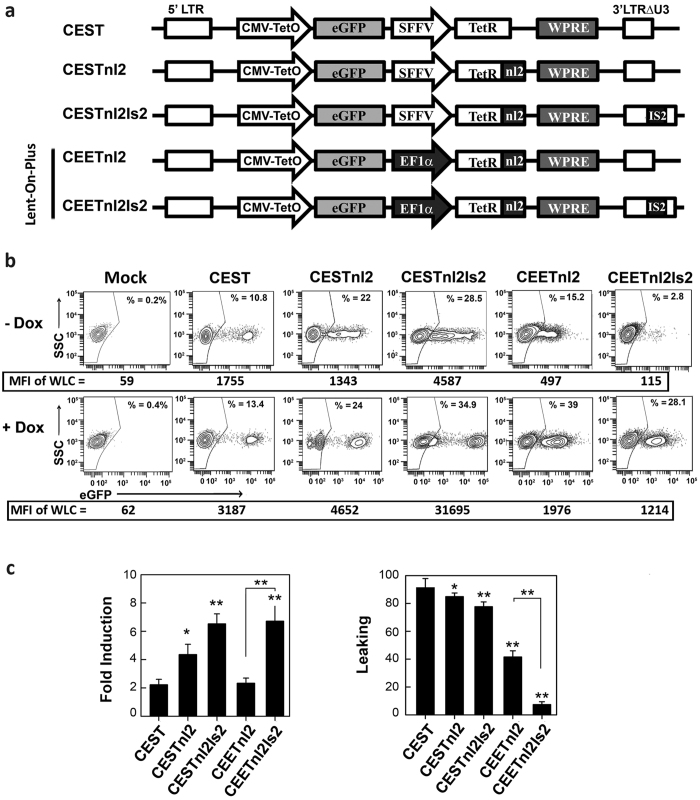
Figure 1. Second generation all-in-one LVs achieve tight transgene regulation in 293 T cells with just one copy integration/cell.
(a). Schematic representation of the CEST LV22 (top) and the new all-in-one Tet-On LVs developed in this study (CESTnl2, CESTnl2Is2 and the Lent-On-Plus LVs: CEETnl2 and CEETnl2Is2). CMV (CMV-TetO); eGFP (enhanced green florescence protein); SFFV (spleen focus forming virus LTR promoter); hEF1α (human eukaryotic translocation elongation factor α1 promoter); TetRnl2 (TetR repressor incorporating the nuclear localization signal of the glucocorticoid receptor: see Fig. S1 for details). (b) Representative plots showing eGFP expression profiles of untransduced 293 T (Mock) and 293 T cells transduced with the different LVs (as indicated at the top of each plot) in the absence (top) or presence (bottom) of Dox (0.1 μg/ml). A MOI = 0.3 was used to keep the percentage of eGFP+ cells below 30% (in order to keep transduced cells with only one LV integration). The gates of the eGFP+ populations were set to 0.2–0.4% of eGFP+ cells in the untransduced population (Mock; left plots) and subtracted to the % obtained under the different vectors and conditions for the analysis. The percentage (%) of the eGFP+ population (used to measure leaking) are shown in each plot. The MFI of the whole living cells (WLC) (used to measure fold induction) are indicated at the bottom of each plot (c). Graphs showing fold induction (left) and leaking (right) of the different LVs in 293 T. Fold induction and leaking were calculated as indicated in M&M. To measure leaking, the background (% of eGFP+ of Mock cells) were subtracted to the % of the eGFP+ under the different conditions. Values represent mean +/− standard error of the mean of at least four separate experiments (*p < 0.05; **p < 0.01). Asterisks indicate significance related to CEST (on top of the bars) or significance between the CEETnl2 and CEETnl2Is2 (as indicated in the Figure)

