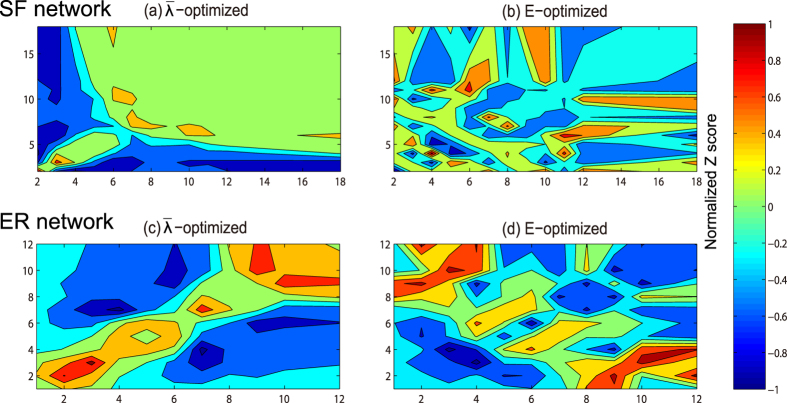
Figure 3. The correlation profiles of the  -optimized network and the E-optimized network based on scale-free network and ER random network.
The Z score value is normalized to a range of −1 to 1 and indicated by the color. The higher the value of Z(di, dj) score is, the more links between di-degree nodes and dj-degree nodes the network has.

