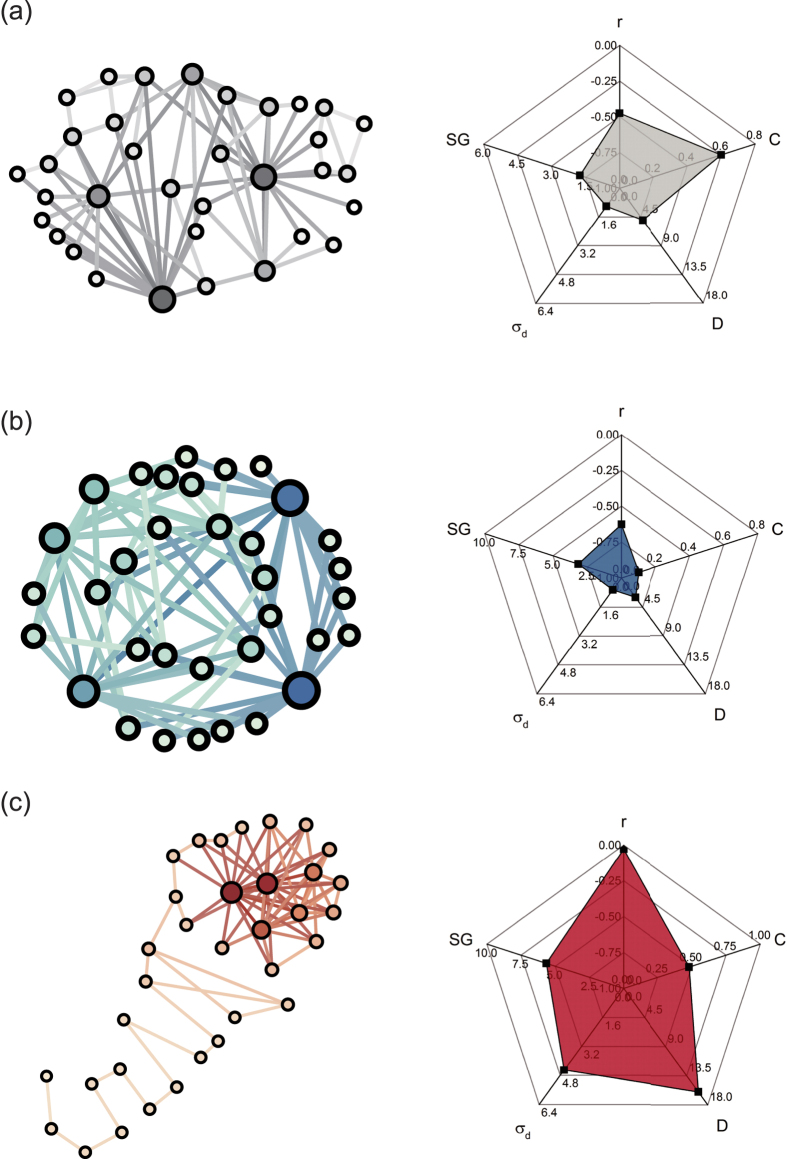
Figure 5. The visualization of original network and the optimized networks and their topological properties.
(a) original network, (b) E-optimized and (c)  -optimized network have the same degree sequence. The degree of node is proportional to its size. The radar graphs show the values of topology metrics including assortativity coefficient r, clustering coefficient C, network diameter D, standard deviation of distance distribution σd and spectral gap SG.

