
Figure 6. Pareto-optimal fronts in the multi-objective optimization for  and E.
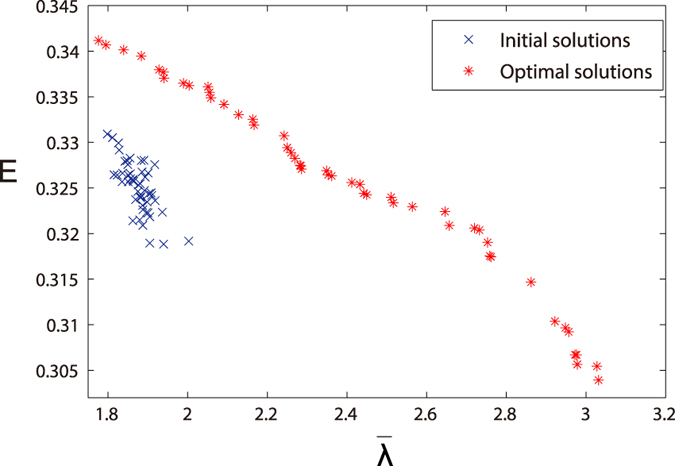
The red points represent the optimized networks, and the blue points represent the original networks. The size of population is 50. Each solution in population is a scale-free network with 100 nodes, 179 links and power-law exponent γ = 3.