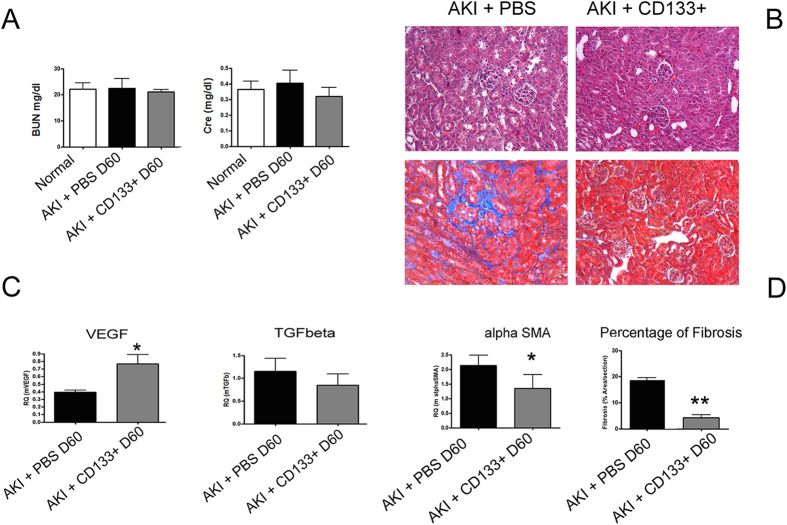
Figure 4. Effect of CD133+ cells on fibrosis and vascularization at day 60.
(A) Plasma analysis for BUN and creatinine in AKI mice showing normalized renal function at day 60 after injury. (B) Representative micrographs of H&E and Masson’s trichromic staining of renal tissue in mice treated with PBS or CD133+ cells at day 60 after glycerol injection. Original magnification 200×. (C) qPCR analysis of whole kidney lysates for the pro-angiogenic factor VEGF and for the fibrotic factors TGF-β and α-SMA. Data are mean ± SD of three independent experiments and are normalized to GAPDH mRNA and to 1 for normal and expressed as relative quantification (RQ). (D) Quantification of fibrosis in the interstitium by Image J software was performed on 10 fields/section in two sections/mouse. T-test: **p < 0.01; * < 0.05.

